
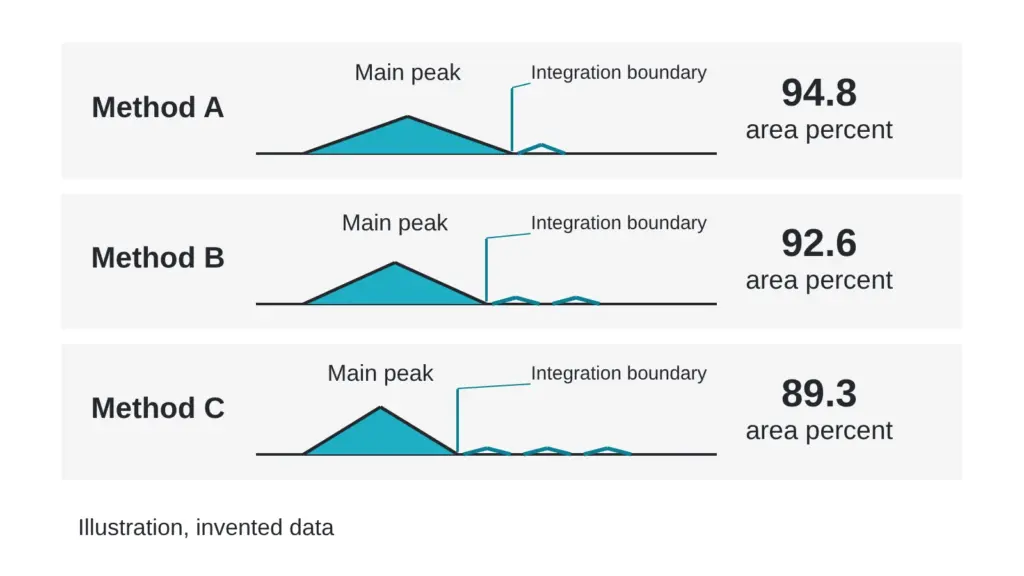
Picture two reports on the same sample. One lists purity at 94.8 percent. The other lists 89.3. Both laboratories ran their instruments correctly, and both numbers honestly describe what each method saw. Every number in this article is invented for teaching.
The gap comes from the method, not from the sample. Three settings do most of the work: the column, the gradient and the detection wavelength, with integration as a quiet fourth. By the end you should be able to read a method line and guess which way a number could move. Terms are defined in the The testing glossary: 14 lab terms in plain English.
What a purity number is made of
Chromatographic purity is an area ratio. The software adds the area under every peak it detects and reports the main peak’s share. Anything the method cannot separate from the main peak, or cannot detect, never reaches the total.
A purity number is a photograph taken through one window. Change the window and the picture changes, though the room stays the same.
For synthetic peptides, reversed-phase liquid chromatography is the usual quality control tool. A published strategy paper calls it essential that no impurity co-elutes with the target peptide, and it lists look-alike impurities such as substitutions, chain cleavages and mirror-image forms as the hard cases (Stoll et al., 2023).
Setting 1: the column
The column is a tube of packed particles. Its surface chemistry decides which molecules linger and which hurry through. Swap to a column with different chemistry and the lineup reorders. An impurity that rode inside the main peak on one column can step out on another, and a number that looked clean suddenly carries a visible neighbor.
A purity number therefore belongs to a column. A report that leaves out the column description leaves out half the method.
Setting 2: the gradient
The gradient is the recipe for how fast the solvent mixture changes during the run. A steep gradient squeezes peaks together and shortens the run. A shallow one spreads them out and gives close neighbors room to separate.
One study used a defined library of peptide impurities and measured how gradient steepness, flow rate, temperature and mobile-phase modifier each shaped selectivity and resolution. Flow rate and modifier choice had the largest effect, and the authors pointed out that even minor impurities can distort analytical readings (Streuli et al., 2026). The gradient is one knob among several, and any of them can decide whether two species show up as one peak or two.
Setting 3: the detection wavelength
A UV detector measures how much light molecules absorb at a chosen wavelength, and different molecules absorb differently. Area percent quietly assumes every species responds the same. When they do not, a weak absorber is under-counted and a strong absorber is over-counted.
Laboratories correct for this with relative response factors, which scale each impurity’s area toward its true amount. A paper on impurity quantitation compared UV detection with a second detection mode, discussed relative response factors for UV-based methods, and cautioned that converting area percent straight to weight percent can introduce significant errors under some conditions (Liang et al., 2008).
The quiet fourth setting: integration
Integration rules tell the software where a peak starts and ends, where the baseline sits and how large a bump must be to count. Raise the threshold and tiny peaks drop out of the total. Lower it and baseline noise may join. Two analysts can draw different baselines under the same peak and report different numbers from one file.
Same sample, three methods
The table below uses invented numbers. The sample is the same in every row.
| Method | Setup | Reported purity (invented) | What the method saw |
|---|---|---|---|
| A | Column type 1, steep 10-minute gradient, narrow wavelength, default threshold | 94.8 percent | Two impurities merged into the main peak. One weak absorber went unseen. |
| B | Column type 2, shallow 30-minute gradient, narrow wavelength, default threshold | 92.6 percent | One merged impurity separated and was counted. |
| C | Column type 2, shallow 30-minute gradient, broad low-UV wavelength, tight threshold | 89.3 percent | Weak absorbers became visible and were counted. |
None of the three is wrong about its own conditions. The mistake is putting A next to C and treating them as one measurement. The fair reading of this table is “the sample looks cleaner the less the method can see,” and the lower numbers came from methods that could see more.
Myth versus reality
A higher purity number means a better sample. Reality: a higher number means one of two things, either the sample is cleaner or the method saw less, and the number alone cannot say which. Method B above reads lower than method A because it separated more, not because the sample changed.
How to read a method line
Suppose a report says: “reversed-phase column, 30-minute shallow gradient, UV at a narrow wavelength, integration threshold set low” (invented). Each phrase predicts something. A shallow gradient means close neighbors had room to separate. A narrow wavelength means species that absorb weakly elsewhere may be missed. A low threshold means small peaks were counted. Read together, that line describes a method set up to find impurities, so a lower purity number from it signals a thorough method.
When two reports disagree
Disagreement between laboratories is documented. A comparison of several assays on one dry material found that liquid chromatography readings depended on the laboratory running them, with more precise values from the laboratory working under a good manufacturing practice quality system (Vemuri, 2005). For more on why numbers drift between sites, read Same material, two purity numbers: why labs disagree and What a UHPLC purity number actually measures, and what it skips.
Quick check you can do today
Find four lines on any purity report: column description. Gradient time. Detection wavelength. Integration or reporting threshold. If one is missing, the number has no address, and you cannot compare it with anything. Ask for the missing line and for the chromatogram itself, with labeled axes. Our list of The questions a good testing lab answers without flinching has the wording.
Sources
- Stoll DR, Sylvester M, Euerby MR, Buckenmaier SMC, Petersson P. Journal of Chromatography A, 2023, volume 1693, article 463873. PubMed ID 36871316. DOI 10.1016/j.chroma.2023.463873. Descriptor: method-development paper on two-dimensional liquid chromatography for checking whether impurities co-elute with a target peptide in reversed-phase methods.
- Streuli A, Erckes V, Nardone B, Bedard V, Beland F, Steuer C. Journal of Peptide Science, 2026, volume 32(3), article e70090. PubMed ID 41667417. DOI 10.1002/psc.70090. Descriptor: study of how gradient steepness, flow rate, temperature and mobile-phase modifier affect peptide selectivity and resolution.
- Liang X, Patel H, Young J, Shah P, Raglione T. Journal of Pharmaceutical and Biomedical Analysis, 2008, volume 47(4-5), pages 723-730. PubMed ID 18400446. DOI 10.1016/j.jpba.2008.02.026. Descriptor: analytical paper comparing two detection modes for impurity quantitation, with discussion of relative response factors for UV methods.
- Vemuri S. Journal of Peptide Research, 2005, volume 65(4), pages 433-439. PubMed ID 15813890. Descriptor: comparison of four assay types for peptide content in a freeze-dried material, including laboratory-to-laboratory variation.
Want the catalog? Register free