
Two reports for the same kind of material sit in a folder, five months apart. The first prints 94.1 percent. The second prints 93.4. Both numbers are invented for this article. The reader feels a small drop in the stomach and wonders what went wrong.
Probably nothing did. A gap of 0.7 points is the movement honest measurements make all the time. Some gaps do deserve a phone call, though, and the size of the headline number turns out to be the weakest clue for telling which. This article gives three tests, a short checklist and a ten-minute habit. Terms are in the The testing glossary: 14 lab terms in plain English.
Five lots that agree to the second decimal deserve more questions than five that scatter a little.
Why no two lots match
Four things move at once whenever a second lot is compared with a first.
- The material itself. Production runs are never identical, so related impurities shift a little in amount. Water and counterion shares shift too, and they are big enough to matter: one published reference-material study deducted 5.46 percent water and 15.48 percent trifluoroacetate ion from a purified peptide (PubMed ID 41916078), and another treated the counterion alone as nearly 25 percent by mass (PubMed ID 30143839). Shares that large can move a content figure by whole points while the chromatographic purity barely twitches.
- The sample. Vials from one lot can differ from each other, as Same batch, different-looking vials: why dry samples vary explains.
- The measurement. The same method on a different day wobbles, and across laboratories it wobbles more. A multi-laboratory collaborative study of peptide quantitation compared three methods and found that the spread between laboratories depended on the method chosen (PubMed ID 30640042). Two honest labs, one vial, two answers: when to shrug and when to worry covers the rest.
- The report. Settings change between reports, and a changed setting changes the number.
Reference-standard work treats variability and outliers as things to plan for. A report on producing peptide reference standards lists considerations for addressing variability and identifying outliers, and describes testing to confirm consistency of the vialed material (PubMed ID 36949371). Variation is expected, so the useful question is how much, and of what kind.
Test one: is the gap bigger than the method’s margin?
An invented example of six lots, with an invented method margin of plus or minus 0.6 points:
| Lot | Area purity, percent (invented) | Gap from the average of A to E |
|---|---|---|
| A | 94.1 | +0.1 |
| B | 93.6 | -0.4 |
| C | 94.4 | +0.4 |
| D | 93.9 | -0.1 |
| E | 94.2 | +0.2 |
| F | 91.2 | -2.8 |
The average of lots A to E is 94.04. Every one of them sits within 0.6 of it, so the spread is inside what the method can resolve. Lot F sits 2.8 points away, nearly five margins, and that alone earns a question. Without a stated margin this test cannot be run, which is a reason to ask the laboratory for one.
Test two: did anything new show up?
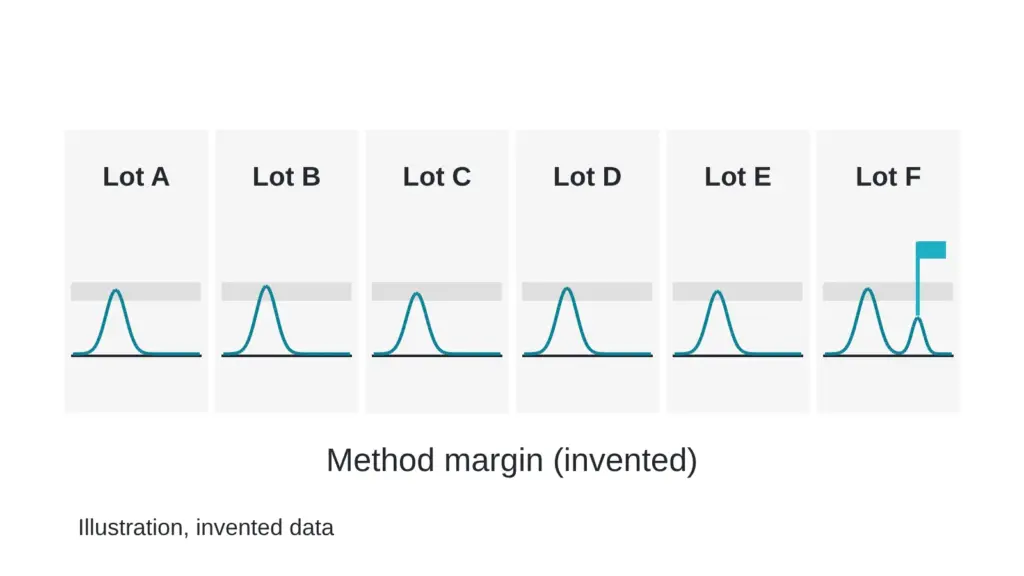
Size is half the story. Compare shapes. Ordinary variation reshuffles the proportions of the same peaks in the same positions. A warning brings in a new peak, removes an old one, or moves the position of the main peak.
In the invented table, the report for lot F also shows a peak at a position never seen in A to E, carrying 2.9 percent of the area. A new peak and a large gap together form a different kind of event from either one alone. Two lots can also print the same headline figure while carrying different impurities, which is one more reason a single number is a thin summary (One number on a report should never end the conversation).
Test three: does it keep going?
One odd lot is a question. Three lots drifting in the same direction form a trend. If each lot is lower than the last by roughly the same step, something upstream is moving. Scatter around a level reads as noise. Steady drift reads as cause. Ask for older reports and line them up before drawing a conclusion.
Seven signs, sorted
Usually ordinary:
- The gap sits inside the margin the laboratory states for its method.
- The same peaks appear at the same positions, with proportions that shift slightly.
- Content moves a little while chromatographic purity holds, because water and counterion shares move.
Worth a call:
- The gap is several times the stated margin.
- A new peak appears, an old one vanishes, or the main peak changes position.
- The identity data changes, such as the measured mass or the fragment pattern.
Hold the comparison:
- The method, column or detection wavelength changed between the two reports. The two numbers now answer different questions, so compare nothing until the settings are known.
What to send the laboratory
A short request works best: “Please send the chromatogram for the previous lot next to this one, at the same scale, with the method settings for both.” A laboratory that can answer in a day has the files in order. One that cannot is giving you information too. More questions worth asking are in The questions a good testing lab answers without flinching.
Quick check you can do today
Line up your last three reports for one material in a grid. Use one column per report and these rows: lot ID, date, method settings, headline number, stated margin, main peak position, and number of impurity peaks. Highlight every cell that differs between columns. Ignore small shifts in the headline number that sit inside the margin. Ask the laboratory about any highlighted cell in the peak position, impurity peak or method settings rows.
Sources
- PubMed ID 41916078, Journal of Chromatography B, 2026, DOI 10.1016/j.jchromb.2026.125038. Descriptor: purity assignment of a purified peptide by mass balance and a second method.
- PubMed ID 30143839, Analytical and Bioanalytical Chemistry, 2018, DOI 10.1007/s00216-018-1272-7. Descriptor: purity assignment for a candidate peptide certified reference material by combined methods.
- PubMed ID 30640042, Journal of Pharmaceutical and Biomedical Analysis, 2018, DOI 10.1016/j.jpba.2018.12.028. Descriptor: multi-laboratory collaborative study comparing three peptide quantitation methods.
- McCarthy D, Han Y, Carrick K, Schmidt D, Workman W, Matejtschuk P, Duru C, Atouf F. Pharmaceutical Research, 2023, volume 40(6), pages 1317-1328. PubMed ID 36949371. DOI 10.1007/s11095-023-03493-1. Descriptor: report on producing and characterizing reference standards for synthetic peptides.
Want the catalog? Register free