
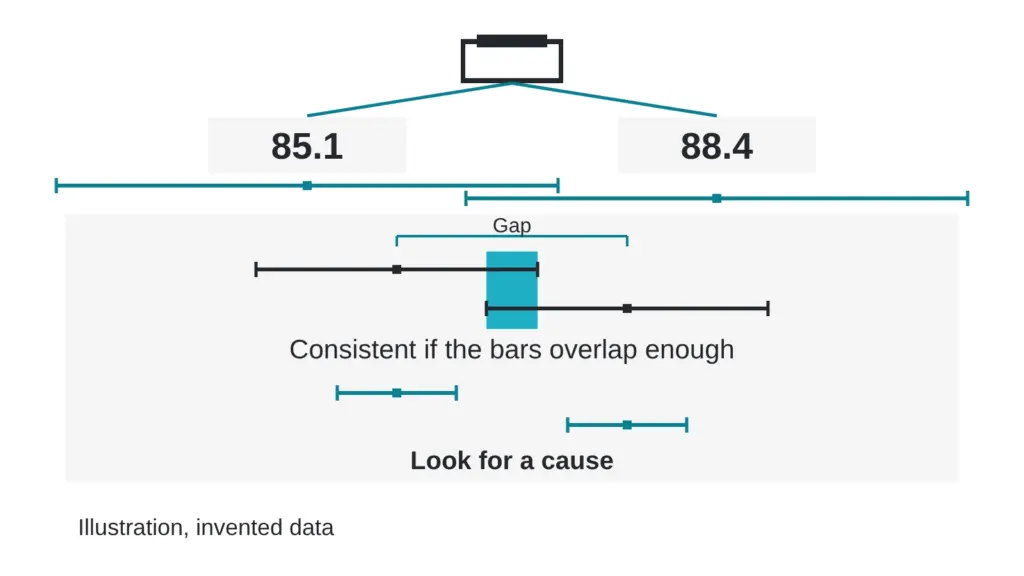
A vial is split in two and sent to two laboratories. One report comes back at 88.4 percent. The other says 85.1 percent. Both figures are invented. Both laboratories are careful, both stand behind their work, and both are telling the truth. A reader looks at the 3.3 point gap and wonders who got it wrong.
Possibly nobody. This article gives you a way to read the gap, six ordinary reasons it appears, four signs that it means something else, and one sentence to send when you cannot decide. Terms are in the The testing glossary: 14 lab terms in plain English.
Two measurements are not in conflict until you compare the gap with the margins they carry.
How big a gap is normal?
Larger than most readers expect. In a validation study that included two interlaboratory comparisons, with 4 and 11 laboratories, relative repeatability scatter was 3.7 to 11 percent and relative reproducibility scatter was 7.8 to 31.2 percent (Chen et al., 2023). Repeatability describes one laboratory repeating its own work. Reproducibility describes different laboratories measuring the same material. The second range sits well above the first, and the paper presents interlaboratory comparison as a way to learn how a method behaves.
A five-laboratory comparison of mass spectrometry methods found good or acceptable overall agreement. Mean bias stayed within 10 percent of the overall mean, except at some sites, where it reached as far as 18.9 percent below it. The authors traced problems to operator errors and to a bias that proficiency testing had not caught earlier (Braun et al., 2023).
Six ordinary reasons honest laboratories disagree
- They measured different quantities. One reports share of detected peak area, the other reports share of weight. The two can differ by many points on the same vial. Same material, two purity numbers: why labs disagree covers this.
- They used different reference standards. In a multi-laboratory collaborative study of peptide quantitation, three methods were compared, and the assay that used the same bulk material as its standard showed the lowest variability between laboratories (Li et al., 2018). Sharing a standard narrows the gap.
- They used different settings. Wavelength, gradient and integration thresholds move the figure without anyone erring.
- The vial changed between splits. A dry solid can take up moisture while it waits to be weighed, so two portions weighed on different days are not identical samples.
- Repeat scatter. Even one laboratory gets slightly different numbers on repeated runs.
- Honest mistakes. Operator errors turned up in the five-laboratory comparison above, and a good laboratory is one that finds and fixes them.
Reading the gap against the margins
Take the invented pair again. Suppose each laboratory states a margin of 3.0 points. Combine two margins by squaring each, adding them and taking the square root, which gives about 4.2 points. The 3.3 point gap sits inside it. The reports agree.
Now suppose each laboratory states a margin of 1.5 points. The combined margin is about 2.1 points, and the same 3.3 point gap lies outside it. The reports disagree, and something in the list above, or below, needs finding. Same gap, different verdict, which is why a report without a stated margin cannot settle the question.
Four signs the disagreement is a warning
- The identity differs. The measured mass or the main peak is not the same in the two reports.
- The peaks differ. One report shows impurities that the other lacks entirely, beyond what a different detection setting would explain.
- The gap exceeds both margins and survives a method exchange. If both laboratories swap method details and the gap stays, one of them has an unexplained problem.
- A laboratory will not share data or conditions. An honest laboratory can show its work.
When the gap stays unexplained, bring in a third laboratory and give it the same instructions as the first two: the quantity to report, the reference to use and the settings to apply. If the third report lands near one of the first two, the pair that agrees has probably shared more of its conditions than the odd one out. If it lands in the middle, the spread is likely ordinary. If it lands far from both, the sample itself deserves a look.
The decision table
| What you see | Likely meaning | What to do |
|---|---|---|
| Gap inside the combined margins | Ordinary scatter | Accept both, note the spread |
| Gap outside the margins, different quantities reported | Different questions | Ask each laboratory what its figure counts |
| Gap outside the margins, same quantity | Standards, settings or handling differ | Exchange methods, reference values and data files |
| Different mass or different main peak | Identity question | Treat as unresolved until a third method agrees |
| No margins or no data offered | No basis to compare | Request both before drawing any conclusion |
Myth versus reality
Myth: when two laboratories disagree, one of them is bad. Reality: disagreement is information about the method, the standard and the sample. The size and direction of the gap tell you which of those to examine first.
Quick check you can do today
If you hold two reports on the same material, write down four things for each: the quantity it counts, the reference standard it used, the main settings, and the margin. Then compute the gap and compare it with the combined margin. If any of the four items is blank, send this line to the laboratory: “Please state what your figure counts, the reference used, the key method settings and the margin of error.” Proficiency programs that give laboratories a regular look at their own spread are described in Labs grading labs: how proficiency testing keeps numbers honest, and the argument over standards is in Reference standards: the quiet argument behind every purity number.
Sources
- Chen Y, Lopez S, Reddy RM, Wan J, Tkachenko A, Nemser SM, Smith L, Reimschessel R. Journal of Veterinary Diagnostic Investigation, 2023, volume 35(5), pages 470-483. PubMed ID 37313802. DOI 10.1177/10406387231178558. Descriptor: validation of a mass spectrometry method with two interlaboratory comparison studies, one an exercise and one a proficiency test.
- Li C, et al. Journal of Pharmaceutical and Biomedical Analysis, 2018, volume 166, pages 105-112. PubMed ID 30640042. DOI 10.1016/j.jpba.2018.12.028. Descriptor: multi-laboratory collaborative study comparing three quantitation methods for a peptide reference standard.
- Braun V, Ceglarek U, Gaudl A, Gawinecka J, Muller D, Rauh M, Weber M, Seger C. Clin Chem Lab Med, 2023, volume 62(5), pages 900-910. PubMed ID 38038605. DOI 10.1515/cclm-2023-0847. Descriptor: five-laboratory interlaboratory comparison of mass spectrometry methods.
Want the catalog? Register free