
A report carries one line that reads “Purity (HPLC)”, followed by a single number. Read the line slowly. “HPLC” names a way of running a sample. “Purity” names a ratio. No word on the line says what sits on the top of the ratio or what sits on the bottom.
This article opens up the phrase. You will see five things it leaves out, an invented vial that shows each gap in milligrams, and a short check for any report you hold. Terms are in the The testing glossary: 14 lab terms in plain English.
The phrase measures the signal, and the vial holds more than the signal.
What the three letters actually name
HPLC is an abbreviation for a liquid chromatography technique. A mixture runs through a column, its parts leave at different times, and a detector records what comes out. The faster, higher-pressure relative is covered in What a UHPLC purity number actually measures, and what it skips, and the trace itself is explained in How to read a chromatogram: what the peaks, shoulders and baseline say.
So “purity by HPLC” can only speak about what the column separated and the detector noticed. The five gaps below are the places where that sentence runs out.
Gap one: the detector favors some molecules
A UV detector draws a bigger peak for a molecule that absorbs more light. Equal weights of two different molecules do not always draw equal areas. Authors of a method paper on impurity profiling note that liquid chromatography usually yields the area percent of the target peak, and that without relative response factors a method cannot tell percent purity from percent weight by weight (Thakkar et al., 2022). A molecule that gives no signal draws no peak at all, so it never enters the ratio.
Gap two: one peak can carry a passenger
Two molecules that behave alike can leave the column together and draw one hump. Authors of a peptide peak-purity study note that compounds with the same mass-to-charge ratio are not readily told apart by mass spectrometry and must be separated chromatographically (Petersson et al., 2023). The detail is laid out in One peak, two molecules: how co-elution hides what is in a sample. A clean-looking main peak counts everything inside it as the main molecule.
Gap three: the counterion rides along unseen
Many dry peptides carry a charged partner. Reference-material scientists do not ignore it. One peptide reference-material paper measured the trifluoroacetic acid counterion by NMR and treated it as an impurity at nearly 25 percent by mass (Melanson et al., 2018). A ratio built from peaks cannot see that weight.
Gap four: water has no peak
Water does not appear on a liquid chromatography trace as a peptide-related peak, yet a dry solid holds some. A mapping study of freeze-dried vials found that residual water varied with container location, shelf contact, radiative heating and packing density, and it compared a headspace measurement with Karl Fischer titration, a separate water method (Cook and Ward, 2011). The water in your vial belongs to your vial, and the chromatography line cannot state it.
Gap five: the gradient decides who gets separated
A steep gradient squeezes peaks together and a shallow one pulls them apart. The two-part peak-purity series describes shallow gradients as necessary for separating isomers in its second-dimension method (Petersson et al., 2023). Two laboratories can run “HPLC” on one vial, use different gradients, and print different purity figures with no error on either side.
An invented vial, in milligrams
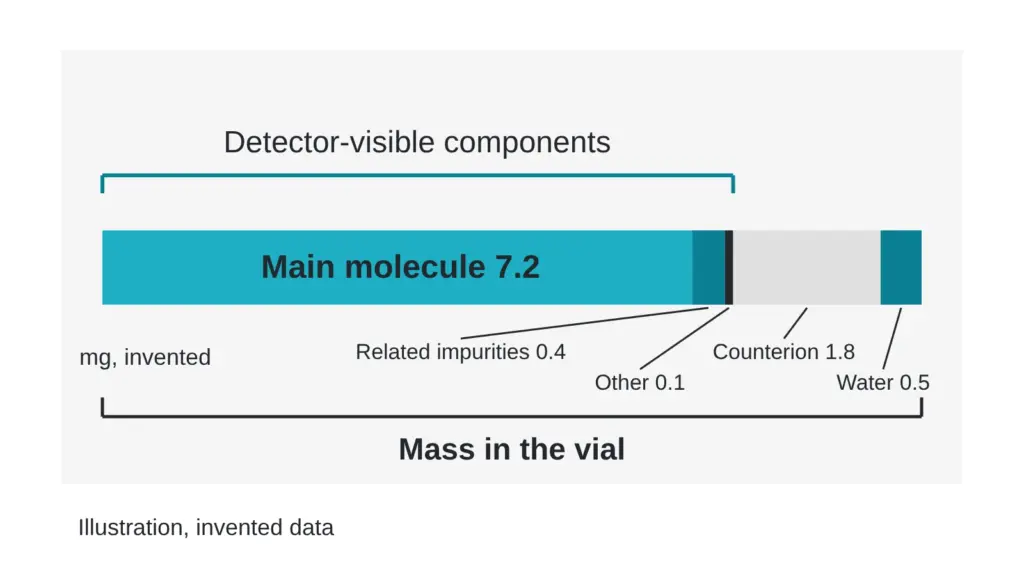
The invented vial below holds 10.0 mg of dry solid.
| Component | Invented amount | Visible to the purity line? |
|---|---|---|
| Main molecule | 7.2 mg | Yes |
| Related impurities seen as peaks | 0.4 mg | Yes |
| Other peaks | 0.1 mg | Yes |
| Counterion | 1.8 mg | No |
| Water | 0.5 mg | No |
Assume equal response for simplicity. The purity line divides 7.2 by the 7.7 mg it can see and prints 93.5 percent. The main molecule makes up 72.0 percent of the weight in the vial. Both numbers are arithmetically correct. The phrase “Purity (HPLC)” is true of the first one only, and the gap between the two is 21.5 points.
The five gaps on one page
| Gap | What the line can say truthfully | What it leaves out | Question to ask |
|---|---|---|---|
| Detector favor | Share of detected area | Molecules that respond weakly or not at all | Was response checked for the impurities? |
| Passenger | A single clean peak | A second molecule inside it | How was the peak checked across its width? |
| Counterion | Peak share | Weight of the charged partner | Is counterion content reported separately? |
| Water | Peak share | Water in the solid | Is water content reported, and by what method? |
| Gradient | One specific number | The separation settings | Can I see the gradient? |
Myth versus reality
Myth: HPLC purity tells you how much of the vial is the molecule you want. Reality: it tells you what share of the detected signal belongs to the main peak, and a separate content value tells you the share of the weight.
Quick check you can do today
Find the line that says “Purity (HPLC)” on any report you hold and look for five companions: the gradient, a statement about checking the main peak for passengers, a counterion value, a water value, and a note about response. Count how many are present. For each one missing, send the laboratory this sentence: “Please state what the purity figure counts, the gradient and detection settings, whether the main peak was checked for co-eluting species, and where water and counterion content are reported.” The weight side is explained in The question every buyer should ask: purity or content?.
Sources
- Thakkar H, Jain S, Kumar S, Bhalekar VS, Gangakhedkar S, Shah RP. Journal of Chromatography A, 2022, volume 1689, article 463725. PubMed ID 36586282. DOI 10.1016/j.chroma.2022.463725. Descriptor: method-development paper on hyphenated liquid chromatography with diode array, charged aerosol and mass spectrometry detection for impurity profiling and relative response factors.
- Petersson P, Buckenmaier S, Euerby MR, Stoll DR. Journal of Chromatography A, 2023, volume 1693, article 463874. PubMed ID 36841023. DOI 10.1016/j.chroma.2023.463874. Descriptor: method-development paper on column and mobile phase selection for peak-purity assessment of pharmaceutical peptides.
- Melanson JE, Thibeault MP, Stocks BB, Leek DM, McRae G, Meija J. Analytical and Bioanalytical Chemistry, 2018, volume 410(26), pages 6719-6731. PubMed ID 30143839. DOI 10.1007/s00216-018-1272-7. Descriptor: purity assignment for a candidate peptide reference material by combining quantitative NMR, LC-MS/MS amino acid analysis and mass balance.
- Cook IA, Ward KR. PDA Journal of Pharmaceutical Science and Technology, 2011, volume 65(5), pages 457-467. PubMed ID 22293835. DOI 10.5731/pdajpst.2011.00760. Descriptor: moisture-mapping study of freeze-dried vials using headspace measurements, compared with Karl Fischer titration.
Want the catalog? Register free