
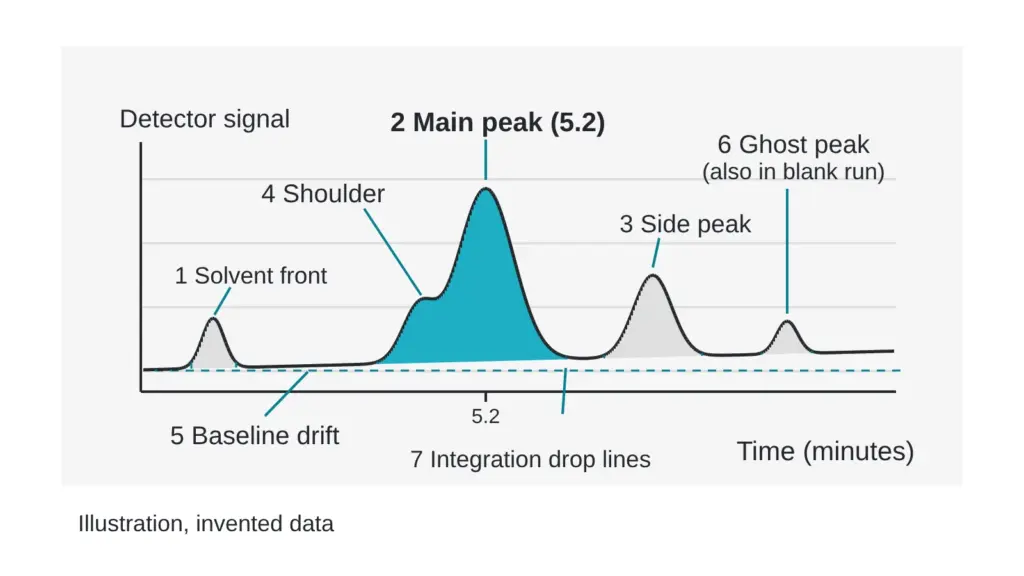
A chromatogram looks like a mountain range with one tall summit, and most readers look at the summit and stop. The summit is the headline. The baseline, the small bumps and the odd bulge on the side of the big peak are the fine print, and the fine print decides what the purity number means.
This guide shows how to read a trace from left to right, what each feature suggests and what to ask about it. It describes an invented trace only. Terms are in the The testing glossary: 14 lab terms in plain English.
The two axes
Time runs along the bottom, usually in minutes. Detector signal runs up the side. Each point on the line shows how much signal the detector saw at that moment as material left the column. A trace without labeled axes is a drawing.
Where a peak sits on the time axis is its retention time. Under a fixed method, the same molecule leaves the column at about the same time, which helps match a peak to a known standard. Under a different method the same molecule leaves at a different time, so times cannot be compared across methods.
Peaks: height, width and area
Height is how far the peak rises. Area is the height and width combined, and area is what purity calculations use. A narrow tall peak and a wide short one can carry the same area.
Peak shape carries clues. A symmetric peak looks like a bell. A peak with a long tail, or one that leans forward, points to something in the method or the sample. In a study of peptide salts on a column, changing the dissolving solvent and the volume loaded changed peak distortion, and only one tested volume gave undistorted peaks (Molineau et al., 2022). The same sample can give different shapes depending on how it was prepared.
Shoulders: the bulge that may hide a second species
A shoulder is a bulge on the side of a peak that does not rise to its own summit. It often marks two species leaving the column almost together. The software may treat it as part of the main peak, as a separate small peak, or ignore it, and each choice moves the area percent.
Modelling work on chromatography suggests overlapping components are highly probable (Castledine and Fell, 1993). Diode-array detection, which records a spectrum across the peak, is one way to test whether a peak is a single species. For peptides, a two-part study used two-dimensional liquid chromatography with mass spectrometry and described it as critical to ensure no impurities co-elute with the target (Stoll et al., 2023). Ask any laboratory how it tested its main peak for co-elution.
A shoulder in the picture is a question, and a flat symmetric peak is not an answer. A symmetric peak can still hide a species that sits exactly beneath it.
Baselines: the quiet line that sets every area
The baseline is the line the signal sits on when nothing is leaving the column. Integration software draws a line under each peak, and the area above that line is counted. Two things matter.
First, flatness. During a gradient the baseline may drift upward as the solvent mix changes. Software then has to decide where the line lies, and two analysts can draw it differently. Same material, two purity numbers: why labs disagree shows how that moves the figure.
Second, the empty regions. A trace that starts at the main peak and stops right after it has cut away the regions where other species leave. The full run should be visible, from the first minute to the end of the gradient.
Small peaks at the edges
At the very start there is often a sharp early signal. It is the solvent front, material that passes through without sticking. It is normally excluded from purity calculations. Late in the run a small peak may be a slow-moving impurity, and a peak that also appears in a blank run, where no sample was loaded, is a ghost from the system. A blank run makes that distinction visible, so ask whether one was done.
A quick reading guide
| You see | It may mean | Ask |
|---|---|---|
| Axes with no labels | a picture, not a trace | can I have the full trace with axes? |
| A bulge on one side of the main peak | two species leaving almost together | how was co-elution tested? |
| A rising or wandering baseline | gradient drift or a dirty system | how was the baseline set? |
| A peak in the same place in a blank | a system ghost | was the blank subtracted? |
| A trace that stops just after the main peak | late species cut off | does the run cover the whole gradient? |
| Tiny peaks missing from the table | a reporting threshold at work | what threshold was used? |
For a wider list of gaps in a report, see Seven red flags on a lab report (and none of them is the purity number). For what the area under these peaks becomes once you turn it into a number, see What a UHPLC purity number actually measures, and what it skips and Area percent vs weight percent: the difference almost nobody explains.
Quick check you can do today: print any chromatogram and draw the baseline under the main peak with a ruler, from where the line leaves flat ground to where it returns. Compare your line with the software’s. If the two differ visibly, ask how the baseline was set.
Sources
- Castledine JB, Fell AF. Journal of Pharmaceutical and Biomedical Analysis, 1993, volume 11(1), pages 1-13. PubMed ID 8466954. DOI 10.1016/0731-7085(93)80143-o. Descriptor: review of strategies for assessing peak purity in liquid chromatography, including diode-array approaches.
- Stoll DR, Sylvester M, Euerby MR, Buckenmaier SMC, Petersson P. Journal of Chromatography A, 2023, volume 1693, article 463873. PubMed ID 36871316. DOI 10.1016/j.chroma.2023.463873. Descriptor: second-dimension gradient strategy in two-dimensional liquid chromatography with mass spectrometry, aimed at co-eluting impurities in pharmaceutical peptides.
- Molineau J, Hideux M, Hennig P, Bertin S, Mauge F, Lesellier E, West C. Journal of Chromatography B, 2022, volume 1213, article 123519. PubMed ID 36370684. DOI 10.1016/j.jchromb.2022.123519. Descriptor: chromatographic study of long-chain peptide salts examining the effect of dilution solvent and sample volume on peak shape.
Want the catalog? Register free