
Picture two reports with the same headline figure. One names its method, its lot and its instrument, and comes with a data file. The other is a cropped screenshot with a number in a text box. The figures match. The evidence does not.
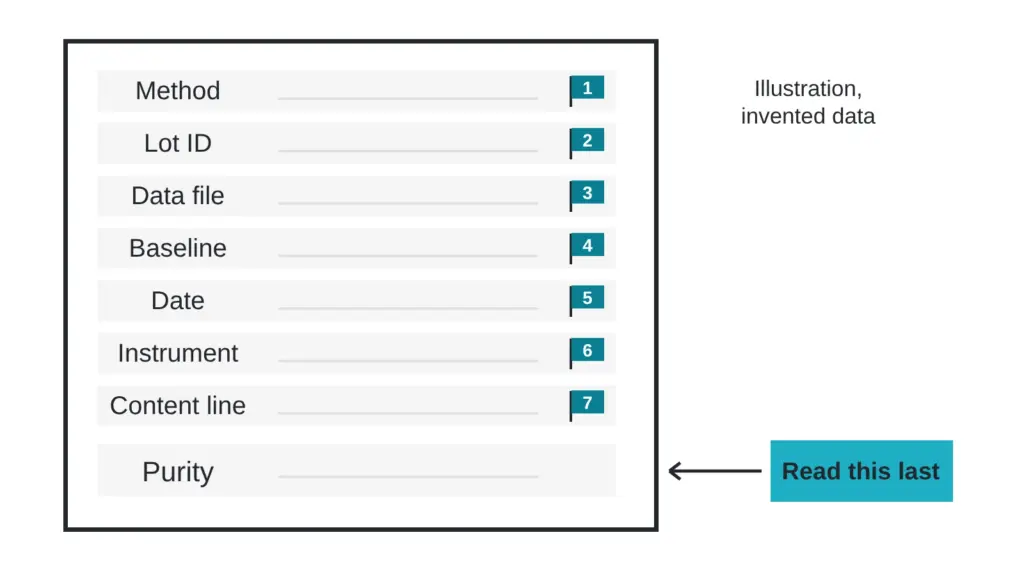
This article lists seven gaps to look for. For each one you get what it looks like on the page, why it matters and the plain question to ask. The purity figure itself is missing from the list on purpose. A figure can be honest and still sit on an empty page, and a modest figure on a full page tells you more than a showy one on a bare page. Terms are in the The testing glossary: 14 lab terms in plain English.
A purity figure on a bare page is a claim. On a full page it is evidence.
Flag 1: no method is named
What it looks like: the page says “HPLC” or “liquid chromatography” and stops. No column, no gradient, no wavelength, no run time.
Why it matters: the number came from specific settings, and the settings change the number. Without them nobody can repeat the work or compare it with another report.
Ask: which column, which gradient, which detection wavelength and how long was the run?
Flag 2: no batch or lot ID
What it looks like: a report titled with a product category, or an ID that differs from the one on the container.
Why it matters: the lot ID links the page to a physical item. Without a match, the report describes some sample from somewhere.
Ask: which container was the tested sample taken from, and where is that ID written on the label?
Flag 3: an image and nothing else
What it looks like: a photo or screenshot of a screen, with no text you can select and no data file offered.
Why it matters: an image cannot be checked for internal consistency, and it carries no time stamp, sequence name or integration table.
Ask: can you send the instrument software’s own export, or the native data file, for this run?
Flag 4: a cropped baseline
What it looks like: a trace that starts just before the main peak and ends just after it, with no axis labels, or an axis zoomed so far in that small peaks flatten out.
Why it matters: modelling work on chromatography suggests overlapping components are highly probable in a chromatogram (Castledine and Fell, 1993). Impurities also leave the column ahead of and behind the main peak. A trace with the first and last minutes cut can hide both. How to read a chromatogram: what the peaks, shoulders and baseline say shows what a full trace should contain.
Ask: can I see the whole run with both axes labeled, plus the integration table?
Flag 5: no date, or a date without a label
What it looks like: one date near the top that could be the analysis date, the issue date or the day the file was saved.
Why it matters: each date records a different event, and only some of them say anything about the age of the material. Sort them with Five dates on a COA and what each one really means.
Ask: on what day were the runs made, and on what day was the document signed?
Flag 6: no instrument and no signer
What it looks like: no instrument identifier, no software version, no analyst, no reviewer.
Why it matters: the raw data live on a particular instrument, and a person has to answer for the report. Without either, no one can be asked a question.
Ask: which instrument ran the sample, and who reviewed the report?
Flag 7: no content figure
What it looks like: a purity line and nothing about water, counterions or the share of the powder that is target molecule.
Why it matters: an area percent measures UV signal. Dry powders hold other mass that the signal does not report. In a study of one synthetic peptide, counterion mass percentages in different batches ranged from zero to about 11 percent for one counterion (Sázelová et al., 2006). Mass-balance work measures water, counterions and other components with their own techniques (Wang et al., 2021). See The salt nobody lists: how a counterion changes what a vial really holds.
Ask: is there a content value, and which method produced it?
How the flags work together
Flags travel in groups. A report with no method usually has no instrument. A report that is only an image usually has no data file behind it. When you see two flags, look for the rest, because the cluster tells you more than any single gap. A single gap, such as a missing date, is often a template oversight that one email fixes.
Order matters too. Flags 1, 2 and 6 are about who and how, and they are cheap for any laboratory to fix. Flags 3, 4 and 7 are about the data itself, and a laboratory’s willingness to supply them says a lot.
Scoring a report
Give a report one point for each flag. Zero or one point, and you can start comparing numbers. Three or more, and the headline figure has no support under it yet.
A bad score leaves the material unjudged and marks a report you cannot use yet. The next step is a request for the missing items, and Is that lab report real? Six checks that take minutes explains how to verify what comes back.
Quick check you can do today: pick one report and write the seven flags down the margin. Mark each as present, missing or unclear. Send the laboratory a single message listing the missing ones.
Sources
- Castledine JB, Fell AF. Journal of Pharmaceutical and Biomedical Analysis, 1993, volume 11(1), pages 1-13. PubMed ID 8466954. DOI 10.1016/0731-7085(93)80143-o. Descriptor: review of strategies for assessing peak purity in liquid chromatography, including diode-array approaches.
- Sázelová P, Kasicka V, Solínová V, Koval D. Journal of Chromatography B, 2006, volume 841(1-2), pages 145-151. PubMed ID 16687256. DOI 10.1016/j.jchromb.2006.04.006. Descriptor: capillary electrophoresis determination of purity and counterion content in batches of a synthetic peptide.
- Wang S, Wu P, Li M, Huang T, Shi N, Feng L, Li H. Journal of Pharmaceutical and Biomedical Analysis, 2021, volume 207, article 114401. PubMed ID 34656934. DOI 10.1016/j.jpba.2021.114401. Descriptor: mass balance purity assignment for a synthetic peptide, including water, counterion, inorganic and volatile solvent determinations.
Want the catalog? Register free