
A report shows a spectrum with a cluster of peaks near m/z 950, another near 713 and a third near 570, and a line that says “expected mass 2847.4, observed mass 2847.4.” The sample is one molecule. Why are there three peaks, and what does that matching line actually prove?
This guide reads an invented spectrum from the axes to the arithmetic, then states plainly what a match confirms and what it leaves open. All numbers are invented for teaching. Terms are in the The testing glossary: 14 lab terms in plain English.
A mass spectrum is a scale. It tells you what a molecule weighs and nothing about what it looks like.
What do the two axes mean?
The horizontal axis is m/z, the mass of an ion divided by the number of charges it carries. The vertical axis is relative intensity, how many ions of that kind reached the detector, scaled so the tallest peak reads 100.
Two cautions for beginners. First, m/z equals the molecular weight only for an ion with a single charge, and even then the added proton shifts it by about one unit. Second, intensity counts ions and says nothing about grams. A tall peak does not mean a large share of the powder by weight, because molecules differ in how readily they pick up a charge. That is why the method is used mainly to ask what a molecule is. Quantity is a question for other methods. See CHNS, liquid chromatography or LC-MS: which test answers which question?.
Why does one molecule make several peaks?
The usual way to feed a large molecule into a mass spectrometer is electrospray ionization, which charges molecules by adding protons. A larger molecule can take on several charges. Multiply charged ions in electrospray spectra originate from the addition or abstraction of protons, cations or anions (Maleknia and Downard, 2005).
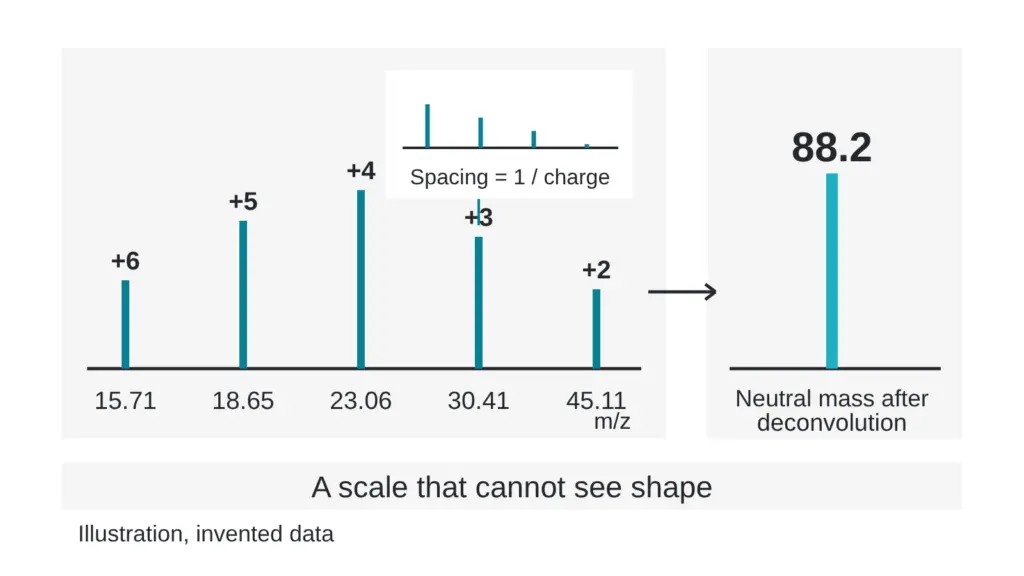
Each charge state makes its own peak. Take an invented molecule with a neutral mass of 2847.4. Adding z protons, each weighing about 1.007, and dividing by z gives the m/z for each charge state:
| Charge state (z) | Invented m/z |
|---|---|
| 2 | 1424.71 |
| 3 | 950.14 |
| 4 | 712.86 |
| 5 | 570.49 |
| 6 | 475.57 |
More charges means a smaller m/z. One molecule, five peaks. The pattern is the signature of one molecule.
How do you get back to the mass?
This step is called deconvolution. It works from the peaks to the neutral mass.
Here is a hand version using two neighboring peaks from the invented table. Call the higher one a, 950.14, and the lower one b, 712.86. For neighbors that differ by one charge, the charge on the higher peak is z = (b minus 1.007) divided by (a minus b). That is 711.853 divided by 237.28, which is 3.00. So peak a carries three charges and peak b carries four. The neutral mass is then 3 times (950.14 minus 1.007), which gives 2847.4, the number we started with.
Software does this for every pair. A published method calculates ratios of m/z values for any two multiply charged ions from a single compound, which identifies each charge state without prior knowledge of which charge carrier was involved (Maleknia and Downard, 2005).
What are the small clusters beside each peak?
Zoom in on one peak on a high-resolution instrument and it splits into a comb. Each tooth is a version of the molecule with one more heavy carbon atom than the tooth before it. The teeth sit about 1.00 mass unit apart, so on the m/z axis they sit 1 divided by z apart. For z = 3 the spacing is 0.33. For z = 4 it is 0.25. Reading the spacing gives you the charge directly. High-resolution data can resolve multiply charged ions into their isotopic components (Maleknia and Downard, 2005).
Other small peaks may sit about 22 units above the expected position of a singly charged ion. These are often sodium adducts, a sign of salt in the sample, and they come from the same molecule.
What does a matching mass prove?
| A matching mass confirms | A matching mass cannot confirm |
|---|---|
| The pieces add up to the expected total, within the stated tolerance | The order in which the pieces are joined |
| The sample contains something with that total | That nothing else is present |
| Consistency with the intended formula | Which mirror-image form is present |
| How much of the powder is that molecule |
Two molecules with the same mass-to-charge ratio are not readily told apart by mass spectrometry, so they must be separated chromatographically, as the authors of a peak-purity strategy put it (Petersson et al., 2023). A pharmacopeial group notes that chiral or isobaric building blocks may call for additional techniques to characterize a reference standard fully (McCarthy et al., 2023). The long form of this argument, with bead-string examples, is in A matching molecular weight is not proof of identity. Here is why.
A second experiment helps. Break the selected ion apart and weigh the pieces. Breaking protonated peptide ions apart by collision typically yields sequence ions (Wee et al., 2002). That fragment pattern speaks to order, which the intact mass cannot. It has limits too. In the same study, two isomeric peptides gave sequence ions of the same m/z under standard fragmentation, and only a different ion-forming approach told them apart. How labs confirm what a molecule is: mass, fragments and structure shows how the pieces combine into a verdict, and One peak, two molecules: how co-elution hides what is in a sample shows why a single peak can still hold two species.
Myth versus reality
A match on observed mass equals a confirmed identity. Reality: a match confirms that the parts add up. Identity needs evidence about order and form as well.
Quick check you can do today
Take the expected and observed masses from any report and compute the gap in parts per million: the difference divided by the expected mass, times one million. Invented example: expected 2847.4, observed 2847.5. The gap is 0.1, which is 35 parts per million. Then look for the stated tolerance. A gap that fits only inside a loose tolerance rules out less than a tight match does. Also look for the charge states used, because a report that lists them lets you rerun the arithmetic above.
Sources
- Maleknia SD, Downard KM. Analytical Chemistry, 2005, volume 77(1), pages 111-119. PubMed ID 15623285. DOI 10.1021/ac048961+. Descriptor: method paper on deconvolution of electrospray mass spectra using the ratio of m/z values of multiply charged ions.
- Wee S, O’Hair RAJ, McFadyen WD. Rapid Communications in Mass Spectrometry, 2002, volume 16(9), pages 884-890. PubMed ID 11948821. DOI 10.1002/rcm.658. Descriptor: tandem mass spectrometry study of two isomeric peptides, comparing standard fragmentation with a radical-cation approach.
- Petersson P, Buckenmaier S, Euerby MR, Stoll DR. Journal of Chromatography A, 2023, volume 1693, article 463874. PubMed ID 36841023. DOI 10.1016/j.chroma.2023.463874. Descriptor: method-development paper on column and mobile phase selection for peak-purity assessment of pharmaceutical peptides.
- McCarthy D, Han Y, Carrick K, Schmidt D, Workman W, Matejtschuk P, Duru C, Atouf F. Pharmaceutical Research, 2023, volume 40(6), pages 1317-1328. PubMed ID 36949371. DOI 10.1007/s11095-023-03493-1. Descriptor: review of how reference standards for synthetic peptides are produced and characterized.
Want the catalog? Register free