
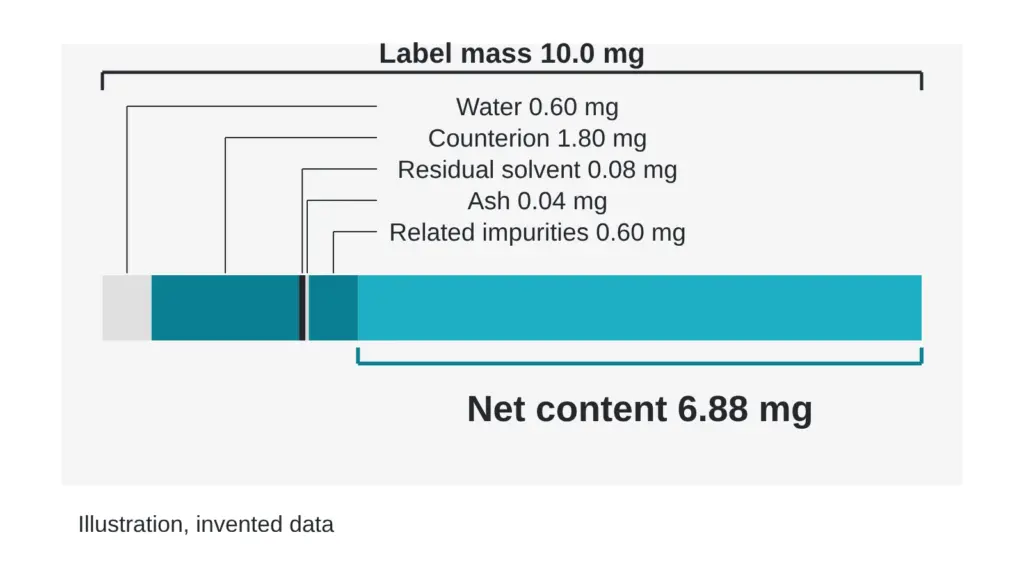
A label says 10.0 mg. The report says purity 92.0 percent. Multiply the two and you get 9.20 mg of the intended molecule, and that number is wrong by about a third. The vial holds roughly 6.9 mg of it. The other 3.1 mg is real material that the purity figure was never designed to count.
This article defines net content, builds it line by line from an invented vial, and gives you a three-question check for any report. Every number in the example is invented for teaching. Terms are in the The testing glossary: 14 lab terms in plain English, and the concept itself is introduced in The question every buyer should ask: purity or content?.
What is net content?
Net content is the mass of the intended molecule, in its free form, per mass of powder. It is a share of the whole vial. Purity is a share of the peptide-related material only.
The powder holds more than molecule. It also holds water, a counterion that balanced the charge during purification, leftover solvent and a little inorganic residue. A review of how reference standards are valued describes the logic: a mass balance assigns a quantitative value to a bulk material, and that bulk material then serves as the standard for the vialed material (McCarthy et al., 2023).
How do you build it from the pieces?
Start with the invented powder: 10.0 mg on the label.
| Line | Invented share of powder | Mass in 10.0 mg | How a lab measures it |
|---|---|---|---|
| Water | 6.0 percent | 0.60 mg | Karl Fischer titration |
| Counterion | 18.0 percent | 1.80 mg | Ion chromatography or a similar method |
| Residual solvent | 0.8 percent | 0.08 mg | Headspace gas chromatography |
| Ash | 0.4 percent | 0.04 mg | Furnace residue |
| Related impurities | 6.0 percent | 0.60 mg | Liquid chromatography |
| Main species (net content) | 68.8 percent | 6.88 mg | What is left, or a direct assay |
The six masses add back to the full 10.0 mg. A mass balance study on a salt compound followed the same pattern: counterion by ion chromatography, related impurities by liquid chromatography, water by coulometric Karl Fischer titration, solvents by headspace gas chromatography with mass spectrometry and non-volatiles by thermogravimetric analysis, each by its own technique (Lee et al., 2023).
Where does 68.8 come from?
Take the first four lines out of the powder. Water, counterion, solvent and ash together are 25.2 percent, which leaves 74.8 percent as peptide-related material. That is the material a purity chromatogram looks at.
Now apply the purity. The invented purity is 92.0 percent, so the main species is 0.920 times 74.8, which is 68.8 percent of the powder. In a 10.0 mg vial that is 6.88 mg. The remaining 6.0 percent of the powder is related impurities.
In one sentence: net content equals the peptide-related share, multiplied by purity.
What went wrong in the opening?
The opening calculation multiplied the label mass by the purity: 10.0 times 0.920 gives 9.20 mg. That treats the whole powder as peptide-related material. It skips the 25.2 percent that is water, counterion, solvent and ash, and 2.32 mg of apparent molecule disappears when you put them back. The label mass overstates the molecule by about a third.
Purity is a ratio inside the peptide. Net content is a ratio inside the vial. The two answer different questions, and a report needs both.
Can a second method check the number?
Yes, and a good report offers one. Suppose an independent amino acid analysis of the same invented powder reports a net content of 67.5 percent, which sits 1.3 points below the 68.8 from the balance. See How labs count what is in a vial: amino acid analysis explained for how that count works. A gap that small is the kind of spread two sound methods can show.
Published comparisons remind us not to expect exact agreement. A study that compared four assay types for one freeze-dried material found that the amino acid method was highly variable in one laboratory and quite precise in another, and that elemental analysis gave highly precise values (Vemuri, 2005). Net content is a measured quantity with a spread, never a constant.
Which assumptions hide inside the example?
- Equal response: the purity of 92.0 percent is an area percentage, and area percentage assumes impurities respond to the detector like the main peak. The article on Area percent vs weight percent: the difference almost nobody explains covers how far that can drift.
- Counterion count: the 18.0 percent line is only as good as the method behind it. A study on exchanging a strong-acid counterion in synthetic peptides stressed that counterion quantification and specification matter for work with these materials (Erckes et al., 2025).
- Small lines: solvents and ash are tiny here, and The small numbers that move a mass balance: residual solvents and ash shows what happens when a report drops them.
Quick check you can do today
Pick any report and answer three questions in writing. One: what is the denominator of the content figure, the powder or the peptide-related material? Two: which lines were measured and which were assumed? Three: did a second method land nearby? Then write one sentence: “Of the 10.0 mg of powder, X mg is the intended molecule.” If the report does not let you fill in X, it has not reported net content, and the next step is to ask the laboratory for it.
Sources
- McCarthy D, Han Y, Carrick K, Schmidt D, Workman W, Matejtschuk P, Duru C, Atouf F. Pharmaceutical Research, 2023, volume 40(6), pages 1317-1328. PubMed ID 36949371. DOI 10.1007/s11095-023-03493-1. Descriptor: review of how reference standards for synthetic peptides are produced and characterized, including a two-step mass balance value assignment.
- Lee S, Baek SY, Kwon HJ, Choi KH, Han J. Molecules, 2023, volume 28(22), article 7568. PubMed ID 38005289. DOI 10.3390/molecules28227568. Descriptor: mass balance purity method for a small-molecule salt, with counterion, related impurities, water, solvents and non-volatiles each measured by a separate technique.
- Vemuri S. Journal of Peptide Research, 2005, volume 65(4), pages 433-439. PubMed ID 15813890. DOI 10.1111/j.1399-3011.2005.00225.x. Descriptor: comparison of four assay types for peptide content in a freeze-dried material, covering precision and laboratory dependence.
- Erckes V, Streuli A, Chamera Rendueles L, Kramer SD, Steuer C. Pharmaceuticals, 2025, volume 18(8), article 1163. PubMed ID 40872554. DOI 10.3390/ph18081163. Descriptor: study of analyzing and exchanging a strong-acid counterion in synthetic peptides, with validated detection methods.
Want the catalog? Register free