
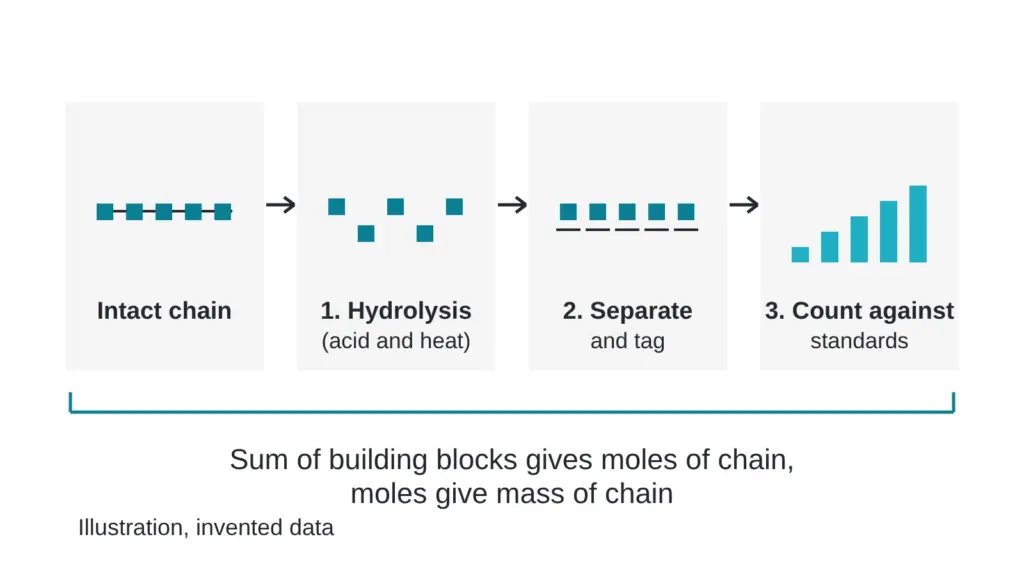
Most tests leave the molecule in one piece. Amino acid analysis takes it apart on purpose. A lab boils the sample in strong acid until the chain falls into loose building blocks, then counts the blocks one kind at a time. It sounds destructive, and it is, but it answers a question no purity chromatogram can: how much of the molecule is in the powder?
This article walks through the three steps, shows why the answer is a content figure and never a purity figure, and lists the places the count can slip. Terms are in the The testing glossary: 14 lab terms in plain English. The difference between purity and content is in The question every buyer should ask: purity or content?.
What happens to the sample, step by step?
| Step | What happens | Where it can slip |
|---|---|---|
| 1. Hydrolysis | Strong acid and heat break every bond in the chain until only single building blocks remain | Some building blocks are damaged or lost by the acid, so the count comes out low |
| 2. Separate and tag | The loose blocks are separated by chromatography, often after a chemical tag (derivatization) makes them easy to detect | The tag can be unstable, and tagging efficiency can vary between runs |
| 3. Quantify | Each block is measured against standards of known amount | Standard preparation and weighing feed straight into the answer |
One published method shows the usual shape. It used hydrolysis in 6 M hydrochloric acid, then measured the released blocks by liquid chromatography with mass spectrometry. Instead of a tag, it spiked in isotope-labeled versions of each building block as internal standards, and it quantified from the ratio of peak areas. The authors note that derivatization has drawbacks, namely derivative instability and poor reproducibility (Qasrawi et al., 2023).
How do loose blocks turn into a mass of molecule?
The sequence is known, so the recipe is known: this chain contains so many blocks of each kind. The count of one kind of block, divided by how many times it appears in the chain, gives the number of chain molecules. The same published method took the sum of the individual building block amounts, based on the known sequence, as the peptide quantity (Qasrawi et al., 2023). Multiply the molecules by the mass of one chain and you have the mass of molecule in the sample. Divide by the mass of powder you started with, and you have content.
Why does it give content and never purity?
Hydrolysis erases the evidence. Once the chain is in pieces, each block carries no memory of which chain it came from. A related impurity built from mostly the same blocks gets counted too. Water, counterions and leftover solvents contribute no building blocks, so they stay out of the count and cost the method nothing.
Amino acid analysis counts the bricks. It cannot tell you whether they came from the right building.
That is why the figure answers “how much peptide-derived material per mass of powder” and why a chromatographic purity figure belongs next to it. Together they say how much of the powder is peptide-related and how much of that is the intended molecule. The Why a 10 mg label can hold only 6.9 mg of the molecule: a worked example does the arithmetic with invented numbers.
Where do the counts go wrong?
Acid is rough on some building blocks. One validation paper tested protecting agents to keep a fragile building block stable during hydrolysis (Allenspach et al., 2018), and the mass spectrometry method above measured its sulfur-containing blocks in their oxidized forms (Qasrawi et al., 2023). Either way, the analyst has to know which blocks survive and correct for the ones that do not.
Laboratories differ too. In a comparison of four content methods on one freeze-dried material, the amino acid analysis method varied widely in one laboratory and was quite precise in another, while elemental analysis gave highly precise values (Vemuri, 2005). In a multi-laboratory study of one small peptide, the pharmacopeial group compared amino acid analysis with a liquid chromatography assay and quantitative NMR, and the liquid chromatography assay run against the same bulk material showed the lowest variability between laboratories (Li et al., 2018). No method wins everywhere.
The same validation paper flagged how large the pre-analytical gaps can be. For twelve peptide solutions, it found differences of up to 85 percent between the stated and actual concentration, attributed to salt formation, weighing errors and other pre-analytical pitfalls (Allenspach et al., 2018). A careful count at the end of the line cannot fix a wrong number at the start.
Myth versus reality
Myth: a content figure from amino acid analysis tells you the sample is the right molecule. Reality: it tells you how much peptide-derived material is present. Identity comes from mass spectrometry and, where needed, NMR, as described in CHNS, liquid chromatography or LC-MS: which test answers which question?.
Quick check you can do today
Find the content line on any report and ask four questions. Which method produced it? Was the answer corrected for building blocks that acid destroys? Was it measured against a standard of known amount? Did a second method land nearby? A content figure with all four answers on the page is worth more than one with a long list of digits and none. The How a reference standard gets its number, and who checks the math article shows the subtraction route, which gives a second way to reach the same figure.
Sources
- Qasrawi DO, Petrotchenko EV, Borchers CH. Analytical and Bioanalytical Chemistry, 2023, volume 415(22), pages 5261-5267. PubMed ID 37468754. DOI 10.1007/s00216-023-04840-2. Descriptor: method paper on peptide quantitation by acid hydrolysis followed by liquid chromatography with mass spectrometry and isotope-labeled internal standards.
- Allenspach MD, Fuchs JA, Doriot N, Hiss JA, Schneider G, Steuer C. Journal of Peptide Science, 2018, volume 24(8-9), article e3113. PubMed ID 30009393. DOI 10.1002/psc.3113. Descriptor: validated hydrolysis and fluorescence method for peptide quantification, with a comparison of stated and actual concentrations for a set of peptide solutions.
- Li C, Bhavaraju S, Thibeault MP, Melanson J, Blomgren A, Rundlof T, Kilpatrick E, Swann CJ, Rudd T, Aubin Y, Grant K, Butt M, Shum W, Kerim T, Sherwin W, Nakagawa Y, Pavon S, Arrastia S, Weel T, Pola A, Chalasani D, Walfish S, Atouf F. Journal of Pharmaceutical and Biomedical Analysis, 2018, volume 166, pages 105-112. PubMed ID 30640042. DOI 10.1016/j.jpba.2018.12.028. Descriptor: multi-laboratory comparison of a liquid chromatography assay, qNMR and amino acid analysis for one small peptide.
- Vemuri S. Journal of Peptide Research, 2005, volume 65(4), pages 433-439. PubMed ID 15813890. DOI 10.1111/j.1399-3011.2005.00225.x. Descriptor: comparison of four assay types for peptide content in a freeze-dried material, covering precision and laboratory dependence.
Want the catalog? Register free