
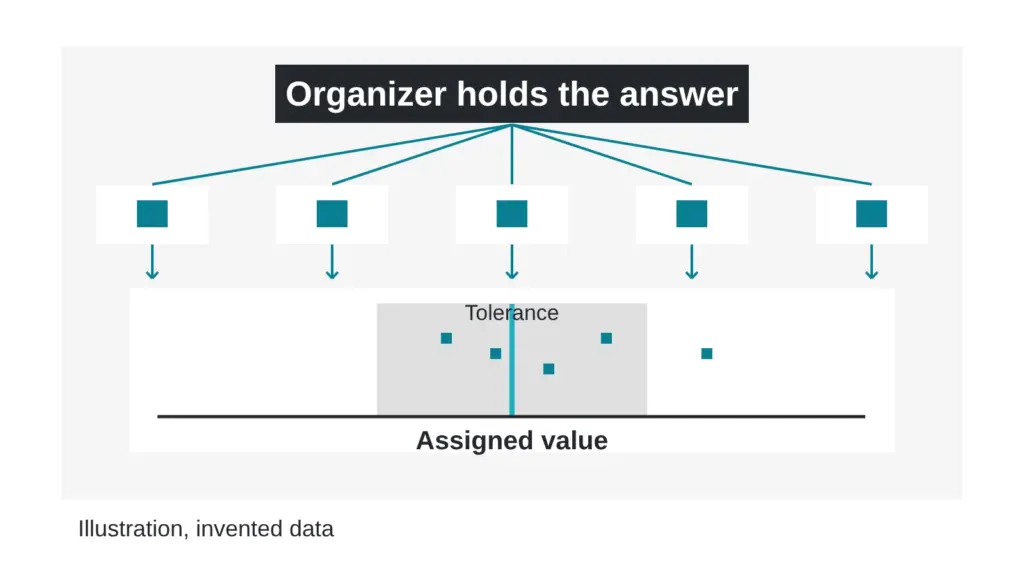
A laboratory can be careful, well equipped and sincere, and still be off by a wide margin without knowing it. Nothing inside the building will reveal the problem, because every check inside the building uses the same instrument, the same standard and the same habits. The only way to find out is to measure a sample whose answer someone else is holding.
That exercise is called proficiency testing. This article covers how a round works, where the “right answer” comes from, how scores are read, and what a good score still leaves unanswered. Terms are defined in the The testing glossary: 14 lab terms in plain English.
What happens in a round?
A proficiency testing round has a simple shape.
- An organizer prepares one batch of sample material and splits it into identical portions.
- Every participating laboratory receives a portion and measures it with its routine method.
- Each laboratory reports its value to the organizer.
- The organizer compares every value with an assigned value and a tolerance, scores each laboratory, and sends back a report.
One published overview describes a long-running scheme of this kind for a single standardized test method. It gathered 26 laboratories around the world, ran one trial a year, treated the data statistically under ISO 13528, and evaluated laboratories individually and collectively under ISO 17043, the general requirements standard for proficiency testing (Zago et al., 2024).
A laboratory marks its own homework all year. Proficiency testing is the day someone else holds the answer key.
Where does the assigned value come from?
There are two common routes. In the first, the organizer calculates the assigned value and the tolerance from the participants’ own data. The overview above describes this approach. In the second, the organizer sets a reference value through a separate study. A reference material paper describes estimating reference values through an interlaboratory comparison that involved laboratories of demonstrated competence working under ISO/IEC 17025 (J AOAC Int, 2022). The accreditation side of that story is in ISO 17025: what the accreditation covers and what it leaves out.
The two routes behave differently. A value built from participants’ data reflects the group. If most laboratories share the same blind spot, the group answer can share it too. A reference value from an independent route can catch that kind of shared drift, which is one reason reference materials carry so much weight; see Reference standards: the quiet argument behind every purity number.
How is a score read?
Many schemes convert each reported value into a score that counts how many tolerance-widths a laboratory sits from the assigned value. A common form is the z-score. The invented example below shows the arithmetic. All numbers are invented for teaching.
| Laboratory (invented) | Reported value | Assigned value | Tolerance unit | Score |
|---|---|---|---|---|
| A | 50.6 | 50.0 | 2.0 | 0.3 |
| B | 53.0 | 50.0 | 2.0 | 1.5 |
| C | 56.0 | 50.0 | 2.0 | 3.0 |
The score is the reported value minus the assigned value, divided by the tolerance unit. Laboratory C sits three tolerance units away and would attract attention from the scheme. Each scheme publishes its own limits, so a reader needs to check the scheme’s rules before treating any score as a pass or a fail.
Why must the sample itself be good?
Every participant must receive effectively the same material. If portions differ, a gap between two laboratories could come from the sample and say nothing about the laboratory. The reference material paper above lists the checks a producer makes: between-unit heterogeneity, stability during dispatch, and the best storage conditions under ISO 17034. It reports that the finished material met the requirements of a proficiency test and was used in one (J AOAC Int, 2022). A round with a poor sample teaches nothing.
What do real schemes reveal?
Between-laboratory spread is wider than within-laboratory spread. In a validation of a liquid chromatography mass spectrometry method followed by two interlaboratory studies, the relative repeatability scatter ran from 3.7 to 11 percent, while the relative reproducibility scatter ran from 7.8 to 31.2 percent (Chen et al., 2023). Repeatability is how well one laboratory agrees with itself. Reproducibility is how well different laboratories agree with one another.
The overview of the long-running scheme reported a relatively constant dispersion of laboratory values, with variability between 10 and 50 percent (Zago et al., 2024). Even with a scheme in place for years, agreement stayed loose for that test method.
What proficiency testing cannot tell you
- It captures a snapshot. One round on one sample on one day says little about a different sample next month.
- It tests the sample type the scheme chose. A score for one kind of material does not transfer to another.
- It can miss problems. A five-laboratory comparison of mass spectrometry methods found a bias that earlier proficiency testing had not identified, and also found operator errors and weaker accuracy at the low end of the measuring range (Braun et al., 2023).
- It says nothing about the sample on your bench. A strong score means the laboratory handles its method well, and the lot in your hand needs its own report.
Quick check you can do today
Open the quality page of any testing laboratory and look for three things: whether it names an accreditation standard, whether it says it takes part in external comparison schemes, and whether it reports scores for the test type you care about. The third is the one most often missing, and it is a fair question to send. More questions of this kind are in The questions a good testing lab answers without flinching, and the reasons two laboratories can disagree are in Same material, two purity numbers: why labs disagree.
Sources
- Zago DI, Ben Bari S, Tirard A, Miksa S, Renoux P, Questel E. International Journal of Cosmetic Science, 2024, volume 46(6), pages 1097-1104. PubMed ID 39051146. DOI 10.1111/ics.13007. Descriptor: overview of a long-running proficiency testing scheme for one standardized test method, including its statistical treatment and the spread of laboratory values.
- Journal of AOAC International, 2022, volume 105(4), pages 1051-1059. PubMed ID 35238378. DOI 10.1093/jaoacint/qsac034. Descriptor: development of a matrix reference material under ISO 17034, with reference values set by interlaboratory comparison and use of the material in a proficiency test.
- Chen Y, Lopez S, Reddy RM, Wan J, Tkachenko A, Nemser SM, Smith L, Reimschessel R. Journal of Veterinary Diagnostic Investigation, 2023, volume 35(5), pages 470-483. PubMed ID 37313802. DOI 10.1177/10406387231178558. Descriptor: validation of a liquid chromatography mass spectrometry method followed by an interlaboratory comparison exercise and a proficiency test.
- Braun V, Ceglarek U, Gaudl A, Gawinecka J, Muller D, Rauh M, Weber M, Seger C. Clin Chem Lab Med, 2023, volume 62(5), pages 900-910. PubMed ID 38038605. DOI 10.1515/cclm-2023-0847. Descriptor: five-laboratory interlaboratory comparison of mass spectrometry methods for a panel of analytes in a biological fluid.
Want the catalog? Register free