
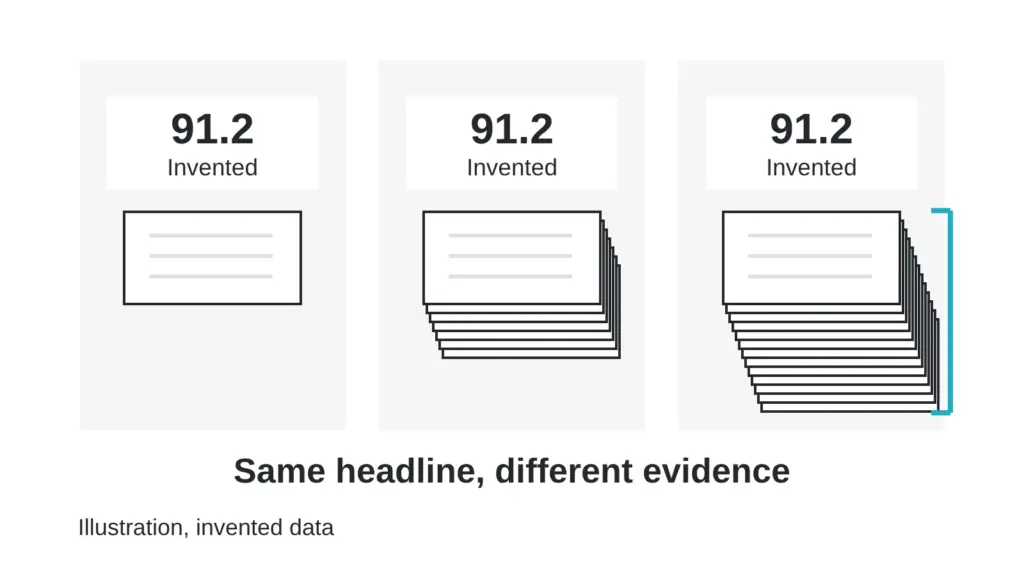
A report arrives with a single line of substance: “Purity: 91.2%”. The figure is invented for this article. There is no method, no margin, no lot, no date. A reader is tempted to nod, because a decimal point looks like precision.
Precision and evidence are different things. This article makes the case that a lone figure should open a conversation and never close one, shows three reports that share a headline and differ in everything else, and ends with a short list of what a report should carry beyond its number. Terms are in the The testing glossary: 14 lab terms in plain English.
One number is a verdict. A report should read like a case file.
What does one number squeeze out?
A single figure compresses a chain of choices into one cell: which molecules were counted, by which instrument, calibrated against what, on which sample, handled how, rounded to how many places. Remove the chain and you cannot rebuild it. Two people can read “91.2” and picture two different measurements.
A decimal place also overstates what most methods can resolve. A figure printed to a tenth of a percent invites the reader to compare it with another figure printed to a tenth of a percent, and the comparison only means something if both carry margins small enough to resolve a tenth.
Same headline, three different reports
All three reports below show 91.2 percent. All values are invented.
| Report A | Report B | Report C | |
|---|---|---|---|
| Headline figure | 91.2 | 91.2 | 91.2 |
| Method named | No | Yes, with wavelength and gradient | Yes, with full conditions |
| What the figure means | Unstated | Share of detected peak area | Share of detected peak area |
| Content (weight) reported | No | No | Yes, by a separate method |
| Water and counterion shown | No | No | Yes |
| Margin of error stated | No | No | Yes |
| Lot and dates | No | Lot only | Lot, analysis date and issue date |
Report A is a claim. Report B is a measurement with a hole in it. Report C is closer to evidence. The headline could not tell them apart.
What does a real value look like?
Reference-material producers show the habit. A pharmacopeial report on synthetic peptide reference standards describes a two-step process: a mass balance approach assigns a quantitative value to the bulk material, then the bulk is used as a standard to assign a final value to the vialed material. It also covers testing for identity, consistency of the vialed material, outliers, variability and stability studies (McCarthy et al., 2023). The value is the end of a documented path.
Even a finished value travels with a margin. A 2026 study of a purified peptide combined a mass balance value with a second method based on amino acid analysis and a mass spectrometry technique, evaluated the margin of error in detail, and assigned a certified value of 78.1 percent with a margin of 1.5 percent (PubMed ID 41916078). The two methods landed on 78.60 and 77.58 percent, close but not identical, and the stated margin is the honest way to carry that gap into the final value.
Margins also grow along a chain. A review of traceability in laboratory medicine notes that each step in a calibration chain carries its own margin, and that the combined margin grows at each step (Miller, 2024). A one-number report hides how many steps stand between the sample and the figure.
A fair word for the headline figure
A headline number has a job. It lets a reader sort a pile of reports quickly, spot a figure that looks far out of line, and decide which pages deserve a closer read. Used as an index, it earns its place on the page.
The trouble starts when the index replaces the book. A reader who stops at the number has skipped the part of the report that says what the number means.
Why do single numbers survive?
They are easy to compare, easy to print on a page and easy to remember. Those are real virtues and they explain the format. They also explain why the format spreads even when the evidence beneath it is thin. The remedy is to accept the number and demand the rest, which is the habit taught in Stop at the big number and you miss the report: how to read a COA.
What should travel with the number?
- The method, with the settings that shape the figure.
- What the figure counts, for example share of detected peak area or share of weight. The difference is explained in The question every buyer should ask: purity or content?.
- A margin of error, even a rough one.
- The lot identifier and both the analysis date and the issue date.
- Whether water and counterion were measured, and how. Mass balance, covered in How a reference standard gets its number, and who checks the math, is one way to account for them.
- How many replicates stand behind the figure.
Myth versus reality
Myth: a precise number is an accurate number. Reality: a number printed to a tenth of a percent shows how it was rounded and shows nothing about how well it was measured. Accuracy comes from the method and the standard it was measured against.
Quick check you can do today
Find a report with one headline figure. Write the sentence “This number counts ____ , measured by ____ , with a margin of ____ .” If you cannot fill all three blanks from the page, the report has given you a number without a meaning. Send the laboratory the three blanks as three questions. The difference between purity, content and identity values is mapped in CHNS, liquid chromatography or LC-MS: which test answers which question?.
Sources
- McCarthy D, Han Y, Carrick K, Schmidt D, Workman W, Matejtschuk P, Duru C, Atouf F. Pharmaceutical Research, 2023, volume 40(6), pages 1317-1328. PubMed ID 36949371. DOI 10.1007/s11095-023-03493-1. Descriptor: report on producing and characterizing reference standards for synthetic peptides.
- PubMed ID 41916078, Journal of Chromatography B, 2026, DOI 10.1016/j.jchromb.2026.125038. Descriptor: purity assignment of a purified peptide by mass balance and a second method, with a stated margin on the certified value.
- Miller WG. Clin Chem Lab Med, 2024, volume 62(8), pages 1462-1469. PubMed ID 38579121. DOI 10.1515/cclm-2023-1201. Descriptor: review of metrological traceability, in which each step in a calibration chain carries a margin that adds to those before it.
Want the catalog? Register free