
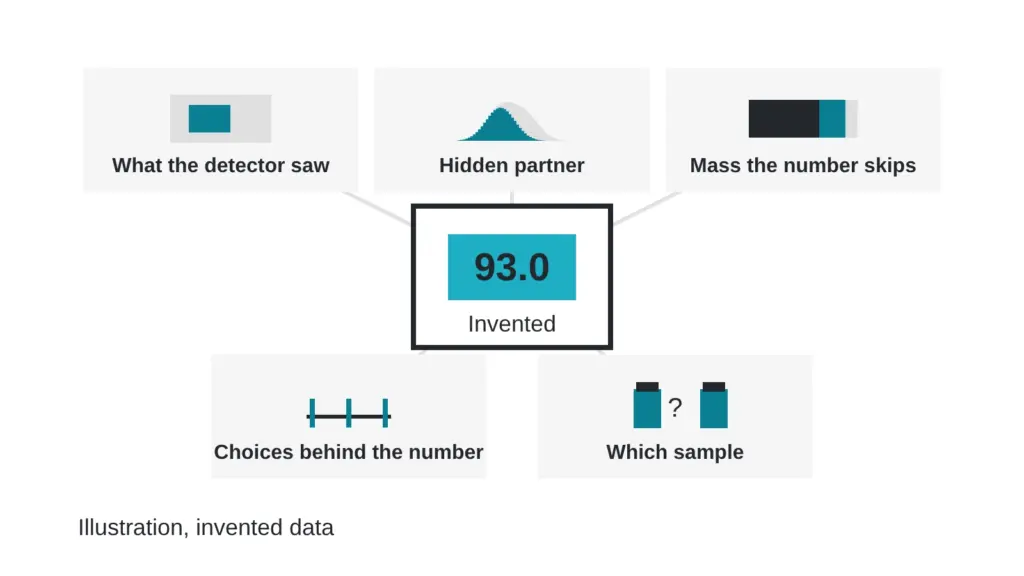
Two reports sit side by side. Each prints 93.0 percent. Both numbers are invented for this article, both were calculated correctly, and both laboratories would defend them. A reader holding either page has no way to tell whether the figure means “nearly everything in this vial” or “nearly everything the detector happened to notice”.
So which report is misleading? Possibly neither. An accurate figure can still answer a smaller question than the one the reader is asking. This article walks through five ways that happens, with a table and a quick check at the end. Terms are in the The testing glossary: 14 lab terms in plain English.
A true number can still be the answer to a smaller question than the one you asked.
Way one: the detector counts only what it can see
Area percent purity divides the area of the main peak by the area of every peak the detector recorded. Anything the detector cannot see never enters the total. Anything it sees faintly enters at a discount, because equal masses of two different molecules do not always produce equal peak areas.
Invented example: a sample holds 43 parts of main material, 4 parts of impurity A and 3 parts of other material. Impurity A responds at half the strength of the main molecule, so its 4 parts draw an area of 2. The areas are 43, 2 and 3, and the report prints 43 out of 48, which is 89.6 percent. The weight share of the main material is 43 out of 50, which is 86.0 percent. The report is arithmetically honest and the picture is rosier than the sample. The mechanics are in Area percent vs weight percent: the difference almost nobody explains.
Way two: a hidden partner shares the peak
Two molecules that behave alike on a column leave it together and draw one hump. Authors working on peptide peak purity call it critical to ensure that no impurities co-elute with the target, and they describe the problem as twofold: impurities span a broad range of properties, and some are very close relatives of the target, such as mirror-image isomers (Stoll et al., 2023). The same group points out that compounds with the same mass-to-charge ratio are not readily told apart by mass spectrometry and must be separated chromatographically (Petersson et al., 2023). A tidy peak can therefore hide a second molecule that gets counted as main material. Three checks that catch it are laid out in One peak, two molecules: how co-elution hides what is in a sample.
Way three: weight the number never touched
Chromatographic purity compares molecules that appear on the trace. Water and counterions, the charged partners that travel with many dry peptides, do not appear in that comparison. They still take up weight in the vial.
Published reference-material work shows the scale. One 2026 study of a purified peptide deducted 5.46 percent water, 0.4 percent structure-related organic compounds, 15.48 percent trifluoroacetate ion and 0.056 percent inorganic impurities, and arrived at an absolute purity of 78.60 percent by mass balance (PubMed ID 41916078). A 2018 study of a candidate reference material treated the trifluoroacetic acid counterion as an impurity at nearly 25 percent by mass (PubMed ID 30143839). Counterions have their own dedicated methods, and a methods paper compared ion chromatography, capillary electrophoresis and isotachophoresis for acetate, trifluoroacetate and chloride (Mrozik et al., 2012). The gap between purity and content is the subject of The question every buyer should ask: purity or content?.
Way four: the number is a pile of settings
Detection wavelength, gradient, integration threshold and column all shape the figure. Change one and the number moves, with no dishonesty anywhere. A report that prints the figure and none of the settings gives you an answer without its question. The three instrument settings that can move a purity number shows three of these dials in action.
Way five: a true number about a different sample
A report belongs to a sample, and a sample belongs to a lot. If the lot identifier on the page differs from the one on the container, or is missing, the report is accurate about something you cannot place. A date can fail the same way, because an old analysis says little about material that has been handled since.
The five ways on one page
| Way | What the report can say truthfully | What it can leave out | Question to ask |
|---|---|---|---|
| Detector view | Main peak share of detected area | Material the detector misses or sees faintly | Was response checked for the impurities? |
| Hidden partner | A clean, single peak | A second molecule under it | How was the peak checked across its width? |
| Missing weight | High chromatographic purity | Water and counterion share | Is content reported by a separate method? |
| Settings | A specific number | The wavelength, gradient and threshold behind it | Can I see the method parameters? |
| Wrong sample | A tidy result | Which vial it came from, and when | Does the lot ID match my container? |
Myth versus reality
Myth: if a number is accurate, it is useful. Reality: a number is useful when you know the question it answers, and every row above is a way of losing the question while keeping the number.
Quick check you can do today
Take any report you have on file and look for five things: the method settings, a statement about the main peak being checked for a hidden partner, a content value reported separately from purity, a lot ID that matches your container, and an analysis date. Count how many are present. Each missing item is one more way the number can mislead you, and each one is a single question to send to the laboratory.
Sources
- Stoll DR, Sylvester M, Euerby MR, Buckenmaier SMC, Petersson P. Journal of Chromatography A, 2023, volume 1693, article 463873. PubMed ID 36871316. DOI 10.1016/j.chroma.2023.463873. Descriptor: method-development paper on two-dimensional liquid chromatography with mass spectrometry for peak purity of pharmaceutical peptides.
- Petersson P, Buckenmaier S, Euerby MR, Stoll DR. Journal of Chromatography A, 2023, volume 1693, article 463874. PubMed ID 36841023. DOI 10.1016/j.chroma.2023.463874. Descriptor: method-development paper on selecting columns and mobile phases for peak-purity assessment of pharmaceutical peptides.
- PubMed ID 41916078, Journal of Chromatography B, 2026, DOI 10.1016/j.jchromb.2026.125038. Descriptor: purity assignment of a purified peptide by mass balance and a second method.
- PubMed ID 30143839, Analytical and Bioanalytical Chemistry, 2018, DOI 10.1007/s00216-018-1272-7. Descriptor: purity assignment for a candidate peptide certified reference material by combined methods.
- Mrozik W, Markowska A, Guzik L, Kraska B, Kamysz W. Journal of Peptide Science, 2012, volume 18(3), pages 192-198. PubMed ID 22252914. DOI 10.1002/psc.1436. Descriptor: methods comparison for counterion determination in synthetic peptides.
Want the catalog? Register free