
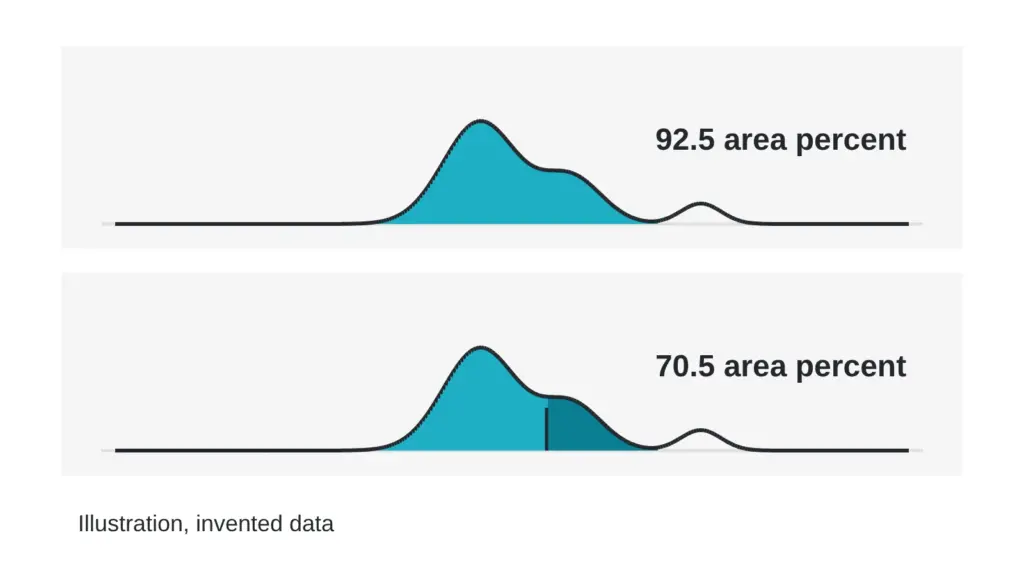
Two laboratories can run the same material and report two different area-percent purity numbers. Neither report has to be wrong. This article walks through the method choices that move the number, so you can compare reports with the right questions in hand. Technical terms are defined in the The testing glossary: 14 lab terms in plain English.
What area percent measures
A liquid chromatography run separates a sample into peaks on a chromatogram. The detector draws each peak, and software calculates the area under it. Area-percent purity is the main peak’s area divided by the total area of all integrated peaks, multiplied by 100.
That is a ratio of detector signals. It is not a mass fraction. It counts only what the detector sees and what the software chooses to integrate.
Here is a teaching example with invented numbers. The main peak has an area of 900 units. The other integrated peaks add up to 100 units. The total is 1,000 units, so the area percent is 90.0. If a second lab merges two small peaks into the main peak, or drops them below a cutoff, the same sample gives a different figure.
Choices that change what separates
Four method settings decide which species end up as separate peaks:
- Column: the stationary phase chemistry, particle size, pore size and length decide which species separate. A closely related impurity may split from the main peak on one column and sit underneath it on another.
- Gradient: a steep gradient squeezes peaks together. A shallow one spreads them out and lengthens the run. The slope near the main peak matters most.
- Mobile phase: the acid additive and the organic solvent change selectivity, so the order in which species leave the column can shift between methods.
- Run length: if the run stops before late species leave the column, those species never enter the total.
Choices that change what the detector reports
Wavelength is the first one. The peptide bond absorbs strongly near 210 to 220 nanometers. Aromatic side chains absorb near 280 nanometers. A lab reading at 280 sees a molecule rich in aromatic residues much better than one without them. The same mixture can therefore give different area percentages at the two wavelengths.
Detector response is the second. Area percent assumes that every species gives the same signal per unit mass. Real species do not. A fragment that lacks an aromatic residue can look smaller than it is at 280 nanometers. Ultraviolet, mass spectrometric and evaporative light-scattering detectors each respond differently to the same sample. One published chromatographic study of long-chain peptide salts used ultraviolet detection at 210 nanometers together with mass spectrometric detection to judge the main peak and its separation from impurities (Molineau et al., 2022).
Some components never appear at all. Water, inorganic salts and counterions give no useful signal under routine ultraviolet conditions, so area percent says nothing about them. The salt nobody lists: how a counterion changes what a vial really holds covers that gap.
Integration and reporting thresholds
Integration software draws a baseline, finds where each peak starts and ends, and decides whether touching peaks are split or merged. Two analysts can draw different baselines under the same peak. A shoulder on the main peak may be counted as part of it, as a separate peak, or dropped. Small changes in these settings move the area percent by a few tenths.
Reporting thresholds add another layer. Many labs ignore peaks below a set fraction of the total area, for example 0.1 percent. A lab with a low threshold counts more small peaks than a lab with a high one. Blank runs matter too. A ghost peak from the gradient can be counted as an impurity, or correctly subtracted.
When you compare two reports, ask for the integration settings and the threshold each lab used.
Sample preparation and co-elution
The dissolving solvent, the concentration and the volume loaded onto the column all change peak shape. In the peptide-salt study above, the choice of diluent and the loaded volume both affected peak distortion and separation from impurities, and only one of the tested volumes gave undistorted peaks. Samples can also degrade, or stick to vial walls, while they wait in an autosampler.
Co-elution is the largest hidden source of difference. When an impurity leaves the column at the same time as the main species, the detector sees one peak, and area percent counts all of it as main material. A deletion sequence, which lacks one residue, often behaves almost like the intended molecule on a column, so it is a common candidate. Mass spectrometry can show two masses under one peak.
One group working on a synthetic peptide calibrator used liquid chromatography with high-resolution mass spectrometry and identified more than 65 structurally related impurities in a single material. They also noted that every approach to assigning purity needs a correction for such impurities (Li et al., 2018).
How to compare two reports
Before you decide that two numbers conflict, line up the method details:
- Do both labs use the same column chemistry, length and particle size?
- Are the gradient slope and run length the same?
- Was the wavelength or detector the same?
- Did both labs use the same integration settings and reporting threshold?
- Were the diluent and the amount of material the same, and was a blank subtracted?
- Did either lab check for co-elution with mass spectrometry or a second method?
If several answers differ, a gap of a few tenths of a percent can be expected. A single area-percent number describes one method on one day. Two numbers from two methods tell you more than either one alone.
Related reading: CHNS, liquid chromatography or LC-MS: which test answers which question? and What a UHPLC purity number actually measures, and what it skips.
Sources
- Molineau J, Hideux M, Hennig P, Bertin S, Mauge F, Lesellier E, West C. Journal of Chromatography B, 2022, volume 1213, article 123519. PubMed ID 36370684. DOI 10.1016/j.jchromb.2022.123519. Descriptor: chromatographic study of long-chain peptide salts using ultraviolet and mass spectrometric detection, examining the effect of dilution solvent and sample volume on peak shape and separation from impurities.
- Li M, Josephs RD, Daireaux A, Choteau T, Westwood S, Wielgosz RI, Li H. Analytical and Bioanalytical Chemistry, 2018, volume 410(20), pages 5059-5070. PubMed ID 29862433. DOI 10.1007/s00216-018-1155-y. Descriptor: liquid chromatography with high-resolution mass spectrometry for identifying and quantifying structurally related impurities in a synthetic peptide calibrator material.
Want the catalog? Register free