
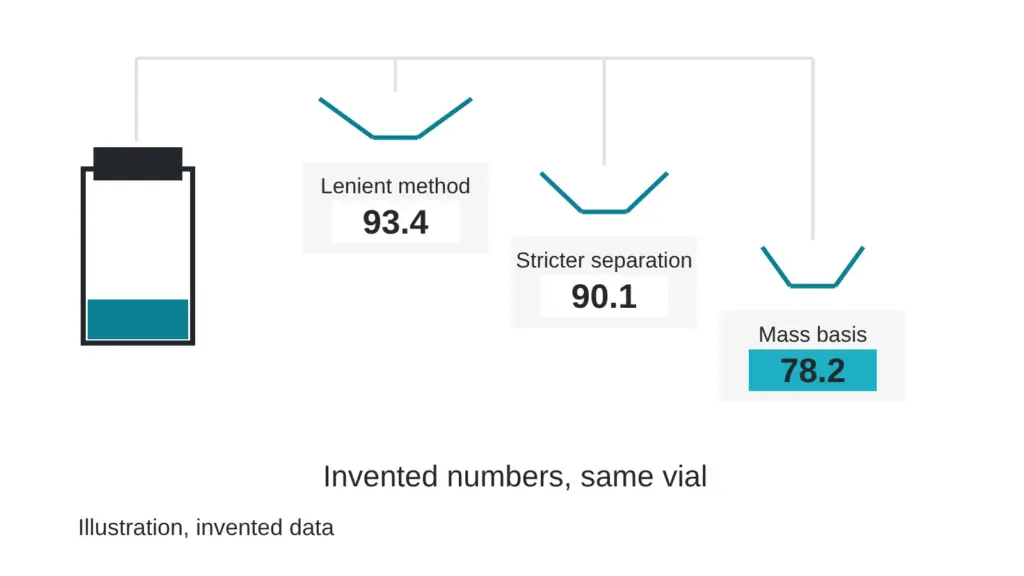
Two reports sit on a desk for what looks like the same kind of material. One prints 93.4 percent. The other prints 88.1 percent. Both figures are invented for this article. Most readers pick the 93.4 within a second, and that reflex deserves a second look.
A purity number is a score earned by a sample and a method working together. Change the method and the same vial earns a different score. Below you will find three dials that make a method stricter, one invented vial run through three methods, and a check you can use on any report you hold. Terms are in the The testing glossary: 14 lab terms in plain English.
A purity number ranks the method before it ranks the sample.
Who really earned that number?
Picture two exams on the same subject. One has ten easy questions and the other has forty hard ones. A student who scores 93 percent on the easy exam has shown less than a student who scores 88 percent on the hard one, because the exam sets the ceiling on what a score can prove.
A purity figure behaves the same way. It reflects how many ways the method looked for trouble and how many of those ways it counted. A report that prints only the figure hides the exam.
Three dials that make a method stricter
| Dial | Lenient setting | Strict setting | Effect on the printed number |
|---|---|---|---|
| Separation | Short, steep gradient, so close relatives leave the column together | Longer, shallower gradient, so relatives split apart | A hidden partner moves out of the main peak and into the impurity total, and the number falls |
| Detector response | Every peak assumed to respond like the main peak | Response of each impurity measured and corrected | A weakly responding impurity gets its true size, and the number moves |
| Counting threshold | High cutoff, so small peaks are ignored | Low cutoff, so small peaks are counted | More impurity area enters the total, and the number falls |
The published literature touches each row. Authors working on peptide peak purity point out that compounds with the same mass-to-charge ratio are not readily told apart by mass spectrometry and must be separated chromatographically (Petersson et al., 2023). The same two-part series describes very shallow gradients as a requirement for separating isomers in its second-dimension method.
On response, authors of a method paper on impurity profiling note that liquid chromatography usually yields the area percent of the target peak, that reporting impurities by weight needs relative response factors, and that without those factors a method cannot tell percent purity from percent weight by weight (Thakkar et al., 2022).
Thresholds cut both ways. A validation study of a mass spectrometry peak-detection feature found the peak intensity threshold to be the most critical setting, because a low threshold can produce false positives and a high threshold can obscure true peaks (Oyugi et al., 2023). Stricter means better matched to the question, and the question has to be stated.
One invented vial, three methods
| Method | What it counts | Printed number (invented) |
|---|---|---|
| A: short run, high threshold, equal response assumed | Main peak share of detected area | 93.4 |
| B: longer shallow gradient, lower threshold | Same measure, with more peaks separated and counted | 90.1 |
| C: method B plus water and counterion measured, stated by weight | Share of the weight in the vial | 78.2 |
One vial, three honest numbers, and a spread of 15.2 points. Method A produced the biggest figure and the thinnest picture of the vial. Method C produced the smallest figure and the fullest one.
Method A answers a quick question quickly, and nothing about it is dishonest. Trouble starts when its answer sits beside C’s answer as if both counted the same thing. The reason a laboratory might pick A is ordinary: routine checks reward speed and low cost, and a lenient method fits that job.
Do strict methods agree with each other?
They tend to land close together, and that agreement is how strictness gets verified. One reference-material study combined three independent routes, quantitative NMR, amino acid analysis by mass spectrometry and mass balance, and reported excellent agreement among them. It stated the final value in milligrams per gram with a margin attached (Melanson et al., 2018).
Look at the pattern. Strict, independent methods converge, the final figure arrives with its margin, and the reader can see how it was built. The lenient number rarely comes with any of that.
Myth versus reality
Myth: the report with the bigger number describes the better sample. Reality: it describes a sample that scored well on its own method. Rank two numbers only when the basis, the separation and the counting threshold match. Otherwise, rank the reports by how much they disclose.
Quick check you can do today
Take two reports and write five lines for each: what the number counts (area or weight), how long and how steep the gradient was, the threshold for counting small peaks, whether impurity response was corrected, and the stated margin. If any line differs between the reports, the two numbers cannot be ranked. If any line is blank, send the laboratory this sentence: “Please state what your purity figure counts, the gradient and counting threshold, whether impurity response was corrected, and the margin.” Three of the dials are shown in action in The three instrument settings that can move a purity number, and the weight side of the story is in The question every buyer should ask: purity or content?.
Sources
- Petersson P, Buckenmaier S, Euerby MR, Stoll DR. Journal of Chromatography A, 2023, volume 1693, article 463874. PubMed ID 36841023. DOI 10.1016/j.chroma.2023.463874. Descriptor: method-development paper on column and mobile phase selection for peak-purity assessment of pharmaceutical peptides.
- Thakkar H, Jain S, Kumar S, Bhalekar VS, Gangakhedkar S, Shah RP. Journal of Chromatography A, 2022, volume 1689, article 463725. PubMed ID 36586282. DOI 10.1016/j.chroma.2022.463725. Descriptor: method-development paper on hyphenated liquid chromatography with diode array, charged aerosol and mass spectrometry detection for impurity profiling and relative response factors.
- Oyugi M, Wang X, Yang X, Wu D, Rogstad S. Journal of Pharmaceutical and Biomedical Analysis, 2023, volume 234, article 115564. PubMed ID 37451094. DOI 10.1016/j.jpba.2023.115564. Descriptor: validation paper on a liquid chromatography-mass spectrometry peptide-mapping approach, including spike-in tests of a new-peak detection feature.
- Melanson JE, Thibeault MP, Stocks BB, Leek DM, McRae G, Meija J. Analytical and Bioanalytical Chemistry, 2018, volume 410(26), pages 6719-6731. PubMed ID 30143839. DOI 10.1007/s00216-018-1272-7. Descriptor: purity assignment for a candidate peptide reference material by combining quantitative NMR, LC-MS/MS amino acid analysis and mass balance.
Want the catalog? Register free