
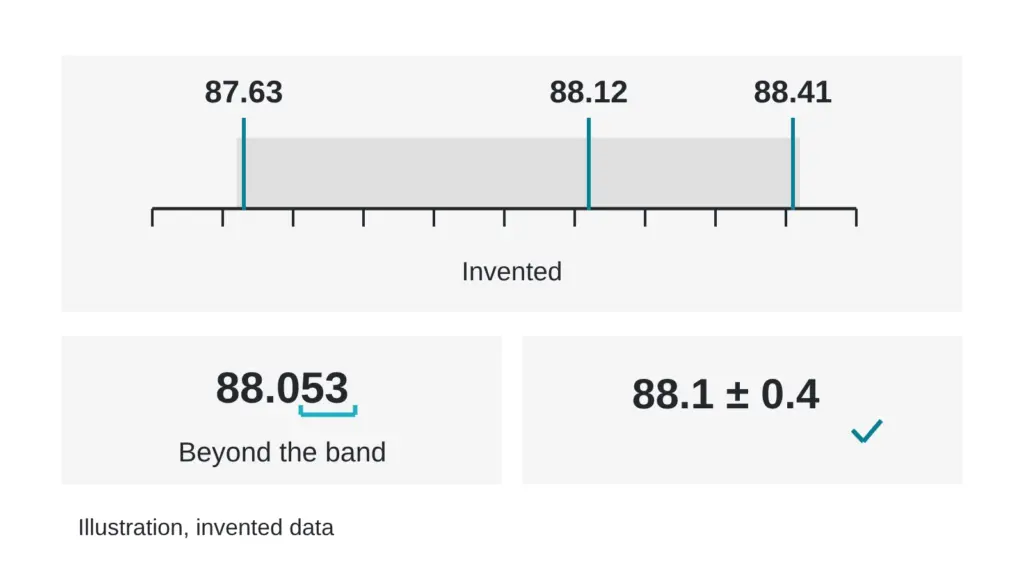
Two reports describe the same material. One prints 88.053 percent. The other prints 88.1 percent. Both figures are invented for this article. Which laboratory looks more careful? The first one does, at a glance, and that glance is the problem. The second report may well be the more careful one.
This article shows how a number’s digits earn their place, runs a small invented example, and gives you a rule for finding the last digit worth trusting. Terms are in the The testing glossary: 14 lab terms in plain English.
A number can only be as sharp as the ruler that measured it.
A ruler marked in centimeters cannot report millimeters
Everyone accepts that rule for a ruler. Nobody reads “14.37 cm” from a ruler with marks every centimeter. The same logic applies to a method that wobbles by half a point from one run to the next: any digit smaller than the wobble describes the calculator and says nothing about the sample.
A short review on significant figures makes the practical point that the choice of reporting interval should rest on analytical imprecision, and that measured values and their reference intervals should carry the same number of significant figures (Badrick and Hickman, 2008). A methods paper on quantifying errors goes further. It argues that when a quantity does not come from random sampling, its error is almost never quantified and the number is often reported in ways that dramatically overstate its precision, and it offers limiting reported significant figures as one straightforward partial remedy (Phillips and LaPole, 2003).
Run it on three invented repeats
Measure the same invented sample three times:
| Repeat | Reading |
|---|---|
| 1 | 88.12 |
| 2 | 87.63 |
| 3 | 88.41 |
The mean is 88.0533, which is how a calculator would show it. The standard deviation is 0.39, and the readings span 0.78 from lowest to highest. Look at the tenths place: it reads 1, 6 and 4. The tenths digit already wobbles, so the hundredths and thousandths digits carry no information about the sample.
A careful laboratory writes 88.1, with a margin of about 0.4. A report that prints 88.053 is promising a sharpness that the three repeats above refuse to support. Calling it dishonest is too strong, since the digits came straight from the arithmetic. Calling it uninformative is fair.
What the literature does with decimals
Reference-material work shows the habit at its best. A purity assignment for a purified peptide reached 78.60 percent with a margin of 0.27 by mass balance and 77.58 percent with a margin of 0.34 by a second method. The certified value was then stated as 78.1 percent with a margin of 1.5 (PubMed ID 41916078). Two decimals went in and one came out, because a margin of 1.5 swallows the second decimal.
Another reference-material paper, which combined three independent methods, gave its final value as 691 plus or minus 9 milligrams per gram with a coverage factor of 2 (Melanson et al., 2018). The margin of 9 sits in the ones place, so the value stops in the ones place. No decimal appears.
The rule: print down to the margin, and stop
Round the margin to one or two significant figures, then round the value to the same decimal place. The table shows the rule at work.
| Margin stated | Last digit worth printing | Example |
|---|---|---|
| 0.04 | Hundredths | 88.05 plus or minus 0.04 (invented) |
| 0.4 | Tenths | 88.1 plus or minus 0.4 (invented) |
| 1.5 | Tenths | 78.1 plus or minus 1.5 (literature value above) |
| 9 | Ones | 691 plus or minus 9 milligrams per gram (literature value above) |
Two companions to the rule. First, carry extra digits through intermediate arithmetic and round only at the end. Rounding early adds error of its own. Second, a coverage factor of 2 after a margin usually signals that the margin was widened to cover roughly 95 percent of expected variation, so read it as a wide net, not a one-run wobble.
Three warning signs on a report
- Many decimals and no margin. The digits have nothing to be checked against.
- A margin larger than the last printed digit by a factor of ten or more. The printed digits are decoration.
- Repeats that agree to the last printed digit every time. Real measurements wobble, so ask how the repeats were produced.
Myth versus reality
Myth: the report with more decimal places is the more precise one. Reality: precision belongs to the method, and decimals only show how many digits the printer chose to print. A margin that matches the last digit is the sign of a laboratory that knows its own ruler.
Quick check you can do today
Take any report with a purity figure and circle its last digit. Find the margin. If the margin is missing, treat the last digit as unverified and ask for the repeat readings. If the margin is present, check that the last printed digit sits at the same decimal place as the margin’s first digit. A figure like 88.053 with a margin of 0.4 fails that test, and it should read 88.1. When two reports disagree in the last digit, compare the gap with the margins as shown in Two honest labs, one vial, two answers: when to shrug and when to worry.
Sources
- Badrick T, Hickman PE. Clin Biochem Rev, 2008, volume 29 (Suppl 1), pages S89-S91. PubMed ID 18852865. Descriptor: short review on significant figures in reporting analytical values.
- Phillips CV, LaPole LM. BMC Medical Research Methodology, 2003, volume 3, article 9. PubMed ID 12892568. DOI 10.1186/1471-2288-3-9. Descriptor: methods paper on quantifying error and reporting precision when numbers do not come from random sampling.
- PubMed ID 41916078, Journal of Chromatography B, 2026, volume 1277, article 125038. DOI 10.1016/j.jchromb.2026.125038. Descriptor: purity assignment of a purified peptide by mass balance and a second method.
- Melanson JE, Thibeault MP, Stocks BB, Leek DM, McRae G, Meija J. Analytical and Bioanalytical Chemistry, 2018, volume 410(26), pages 6719-6731. PubMed ID 30143839. DOI 10.1007/s00216-018-1272-7. Descriptor: purity assignment for a candidate peptide reference material by combining quantitative NMR, LC-MS/MS amino acid analysis and mass balance.
Want the catalog? Register free