
A vial holds 10.0 milligrams of dry powder, and the report says 94.0 percent. How many milligrams of the target molecule are in the vial? From the report alone, nobody can say. The 94.0 is true. It just answers a different question from the one you asked.
This article separates two numbers that share the word percent and almost nothing else. You will see both calculated from one invented powder. Terms are in the The testing glossary: 14 lab terms in plain English.
Area percent is a share of what the detector saw. Weight percent is a share of what sits on the balance.
Two ratios, two denominators
| Area percent | Weight percent | |
|---|---|---|
| What is divided | main peak area by the sum of all integrated peak areas | mass of the target by the mass of the whole powder |
| Instrument | liquid chromatography with a detector, often UV | balance, plus techniques that measure each component |
| What sits in the denominator | only the species that gave a peak | everything in the vial, including water and counterions |
| What it answers | how clean is the separation | how much of the powder is target |
Both are legitimate. Problems start when one is read as the other. The deeper background on the first is in What a UHPLC purity number actually measures, and what it skips.
A worked example with invented numbers
Everything in this section is invented for teaching. Start with the chromatogram.
| Peak | Area (units) |
|---|---|
| Main species | 940 |
| Related peak A | 38 |
| Related peak B | 22 |
| Total | 1,000 |
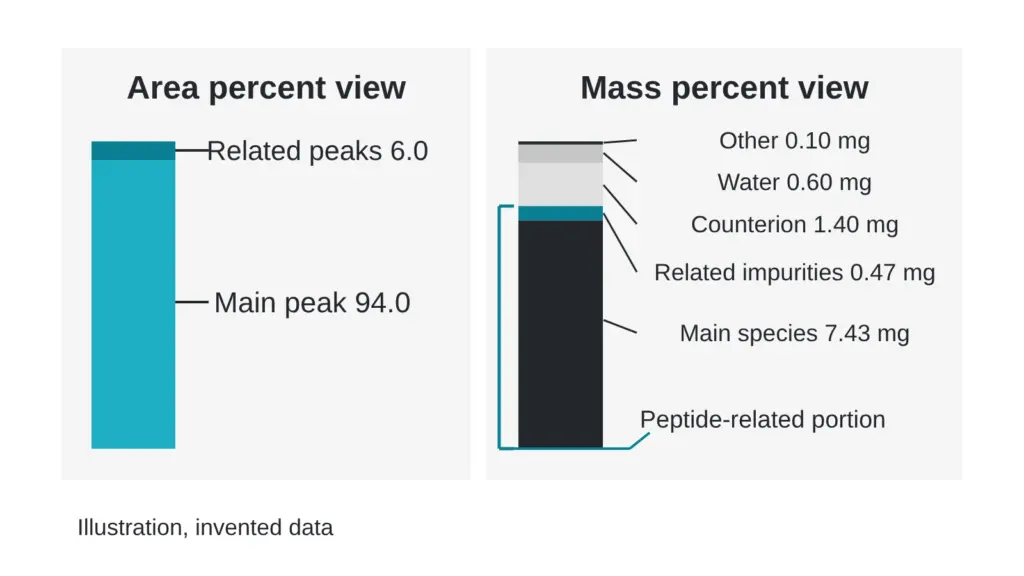
The area percent of the main species is 940 divided by 1,000, so 94.0. Now suppose separate measurements on the same 10.0 mg of powder found water at 6.0 percent, counterion at 14.0 percent and other material at 1.0 percent. Together those are 21.0 percent of the mass, which leaves 79.0 percent as peptide-related material.
If every species has the same response per unit mass, the main species is 94.0 percent of that 79.0 percent, or 74.3 percent of the powder.
| Component | Share of powder | Mass in 10.0 mg |
|---|---|---|
| Main species | 74.3 percent | 7.43 mg |
| Related impurities | 4.7 percent | 0.47 mg |
| Counterion | 14.0 percent | 1.40 mg |
| Water | 6.0 percent | 0.60 mg |
| Other | 1.0 percent | 0.10 mg |
A reader who takes 94.0 as a weight share expects 9.40 mg of target. The invented balance says 7.43 mg, which is about 21 percent less. The chromatogram never lied. Water and counterion simply produced no peaks.
Why the two numbers drift apart
Four things sit between them.
First, water. It is measured by Karl Fischer titration and appears in no UV peak.
Second, counterions. They balance charge in the solid and give no useful UV signal. A study of batches of a synthetic peptide found counterion mass percentages from zero to about 11 percent for one acid (Sázelová et al., 2006), so the gap is not a constant. See The salt nobody lists: how a counterion changes what a vial really holds.
Third, inorganic residue and volatile solvents, each needing its own technique.
Fourth, response. Area percent treats a unit of signal as a unit of mass. An article on peptide impurity quantification notes that using a default relative response factor of 1 may overestimate or underestimate impurities, depending on whether the true value is above or below 1 (Kuril, 2025). The worked example above assumed equal response. A real sample may not oblige.
What a careful weight value looks like
Mass balance adds up every component. A published certification of a peptide reference material gives an example. Its purity was assessed by mass balance and quantitative NMR, with moisture by Karl Fischer, anions by ion chromatography and inorganic elements by inductively coupled plasma mass spectrometry. The value came out as 0.8511 grams per gram, about 85 percent by mass, for the natural material (Deng et al., 2025), and the authors describe the material as high-purity. A mass fraction is a different kind of number from an area percent, and it can sit well below it. How a reference standard gets its number, and who checks the math explains how the pieces are added up.
A second way to reach a weight value is a direct content assay. A comparison of four such assays on one freeze-dried peptide drug substance found that the answers depended on method and on laboratory (Vemuri, 2005), which is why the method behind a content figure deserves a question of its own. CHNS, liquid chromatography or LC-MS: which test answers which question? sorts the methods by the question they answer.
Using both numbers well
Wording gives clues. A figure labeled “area percent” or “area %” is a signal share. A figure labeled “content”, “assay” or “mass fraction”, or written in grams per gram, is a weight share. A bare “purity” with no label can be either, and the laboratory has to say which.
Treat area percent as a statement about separation quality and weight percent as a statement about quantity. A report with both lets you compute the target mass in any weighed amount. A report with only the first leaves that calculation open.
Quick check you can do today: take a report with a purity figure and a content figure. Multiply the weighed mass by the content fraction, not by the purity. If there is no content figure, write that down as the first question for the laboratory.
Sources
- Wang S, Wu P, Li M, Huang T, Shi N, Feng L, Li H. Journal of Pharmaceutical and Biomedical Analysis, 2021, volume 207, article 114401. PubMed ID 34656934. DOI 10.1016/j.jpba.2021.114401. Descriptor: mass balance purity assignment for a synthetic peptide, including water, counterion, inorganic and volatile solvent determinations.
- Deng F, Wang R, Liu K, Wu L, Su R, Liu Y. Analytical and Bioanalytical Chemistry, 2025, volume 417(19), pages 4395-4406. PubMed ID 40536667. DOI 10.1007/s00216-025-05955-4. Descriptor: certification of a peptide reference material, with purity assessed by mass balance and quantitative NMR.
- Kuril AK. Analytical Chemistry, 2025, volume 97(24), pages 12480-12485. PubMed ID 40499007. DOI 10.1021/acs.analchem.5c02149. Descriptor: article on relative response factors in peptide impurity quantification by liquid chromatography with UV detection.
- Sázelová P, Kasicka V, Solínová V, Koval D. Journal of Chromatography B, 2006, volume 841(1-2), pages 145-151. PubMed ID 16687256. DOI 10.1016/j.jchromb.2006.04.006. Descriptor: capillary electrophoresis determination of purity and counterion content in batches of a synthetic peptide.
Want the catalog? Register free