
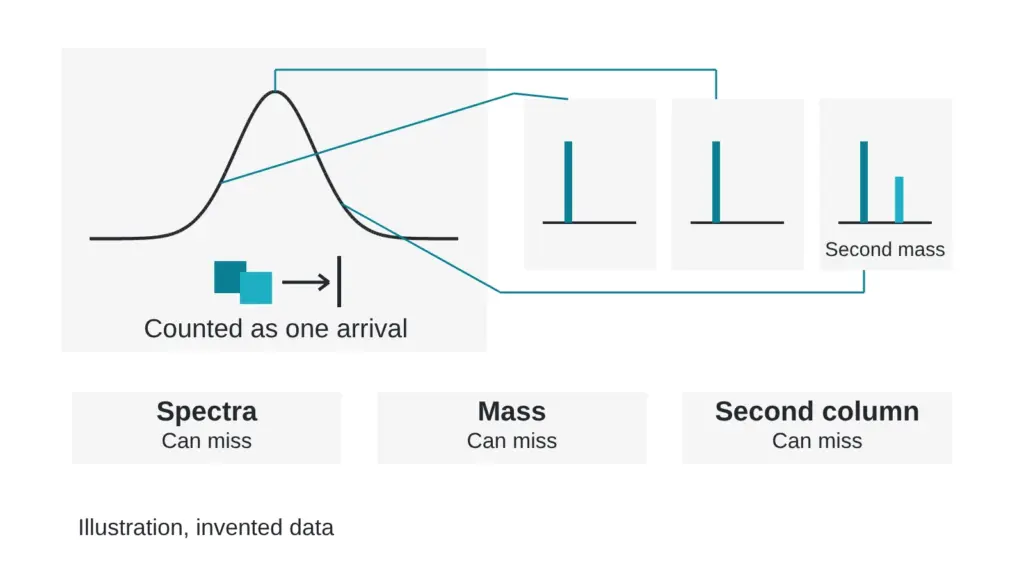
A chromatogram shows one tall, symmetric, textbook peak. The report beside it reads 93.0 percent by area. The trace and the number are invented for teaching. Can that single peak still contain a second molecule that nobody counted?
It can, and the effect has a name: co-elution. This article explains why it happens, which three checks catch it, and what each check misses. Terms are in the The testing glossary: 14 lab terms in plain English.
A peak is a turnstile that counts arrivals. Two people stepping through in lockstep register as one.
Why can two molecules share one peak?
A column sorts molecules by how strongly they cling to its surface while a solvent mix pushes them along. Molecules with similar chemistry cling with similar strength and leave at nearly the same moment. The detector adds up whatever arrives and draws one hump.
Quality control for synthetic peptides usually depends on reversed-phase liquid chromatography, and the authors of a peak-purity strategy call it critical to ensure that no impurities co-elute with the target. They describe the difficulty as twofold: impurities span a broad range of properties, and some are very similar to the target (Stoll et al., 2023). A clean-looking peak settles less than it appears to.
The troublemakers are close relatives of the target. The same authors list unit substitutions and chain cleavages among the impurities that can be present, and mirror-image isomers among the ones most similar to the target (Stoll et al., 2023). A related molecule that hides under the main peak is counted as main material in area percent. The mechanics of that count are in Anatomy of a chromatogram report page: every field, annotated.
Check one: scan the peak with a second detector
A diode-array detector records a full light-absorption spectrum at every moment. If a peak holds one species, the spectrum at the front edge, the summit and the back edge should match. If the spectra drift, software flags a possible second species.
What it can miss: two molecules with nearly identical light-absorption spectra pass the test. Close relatives often absorb alike, because they share most of their structure.
Check two: watch the mass across the peak
Mass detection weighs what is leaving the column, scan after scan. The basics of reading those scans are in Mass spectrometry for beginners: read a spectrum without a chemistry degree. Take scans from the front edge, the summit and the back edge. One mass throughout supports a single species. A second mass appearing on one edge exposes a hidden partner.
Invented example: the summit of a peak at 9.10 minutes shows the target mass, but the back-edge scans also show a second mass 16.0 units higher. Those scans reveal a hidden species that carries 4.1 of the 93.0 percent. The main molecule would then count as 88.9 percent by area, assuming equal detector response, which itself needs checking.
What it can miss: molecules with the same mass look identical to this check. The authors of a two-part peak-purity strategy state the limit directly: compounds with the same mass-to-charge ratio are not readily differentiated by mass spectrometry and must be separated chromatographically (Petersson et al., 2023). A pharmacopeial group likewise notes that chiral or isobaric building blocks may need additional techniques for full characterization (McCarthy et al., 2023). Mirror-image isomers and swapped neighbors are the classic cases, covered in A matching molecular weight is not proof of identity. Here is why.
Check three: run it again on a different column
An orthogonal method separates by a different property. A different column chemistry, a different pH or a different solvent changes which molecules cling to what. Two species that traveled together in the first run may split apart in the second.
Some laboratories automate this. In two-dimensional liquid chromatography, the first dimension detects impurities across a broad range of properties, and the second dimension focuses on species that might co-elute with the target (Stoll et al., 2023). The companion paper evaluated 30 column and mobile phase combinations on more than 300 chromatograms and concluded that screening four columns and four volatile mobile phases should cover the selectivity space (Petersson et al., 2023).
What it can miss: any pair that still behaves alike on the second column. Orthogonal means different, and two methods can fail to separate the same pair. The more different the second method is, the better its odds.
The three checks side by side
| Check | The question it asks | A pair it can miss |
|---|---|---|
| Detector spectra across the peak | Does the light-absorption spectrum change from edge to edge? | Close relatives with matching spectra |
| Mass across the peak | Does the mass change from edge to edge? | Same-mass look-alikes |
| Second method, different chemistry | Does the peak split under other conditions? | Pairs that behave alike on both columns |
The checks complement one another. The weak point of one is often the strong point of another, which is why a report that cites two of them tells you more than a report that cites one.
What a good sentence on a report looks like
Here is an invented example of the kind of line worth looking for: “Main peak assessed by spectra at three points across the peak and by mass scans across the peak, then run on a second column with different selectivity. No second species was detected above the reporting threshold.” It names the checks, names the point of comparison and states a threshold, so a reader can argue with it. Compare that with “peak purity: pass,” which gives you nothing to argue with.
Myth versus reality
A symmetric peak is a pure peak. Reality: symmetry shows that the shape is clean. It cannot show how many molecules share that shape.
Quick check you can do today
Find the sentence in any report that says how the main peak was tested for co-elution. If there is none, send three questions. Was the peak checked across its front, summit and back edge? With which detector? Was a second method with different chemistry run on the same sample? A lab that did the work will answer in a line. Shoulders and other warning shapes on the trace itself are covered in How to read a chromatogram: what the peaks, shoulders and baseline say.
Sources
- Stoll DR, Sylvester M, Euerby MR, Buckenmaier SMC, Petersson P. Journal of Chromatography A, 2023, volume 1693, article 463873. PubMed ID 36871316. DOI 10.1016/j.chroma.2023.463873. Descriptor: method-development paper (part two of two) on two-dimensional liquid chromatography with mass spectrometry for peak purity of pharmaceutical peptides.
- Petersson P, Buckenmaier S, Euerby MR, Stoll DR. Journal of Chromatography A, 2023, volume 1693, article 463874. PubMed ID 36841023. DOI 10.1016/j.chroma.2023.463874. Descriptor: method-development paper (part one of two) on selecting columns and mobile phases for peak-purity assessment of pharmaceutical peptides.
- McCarthy D, Han Y, Carrick K, Schmidt D, Workman W, Matejtschuk P, Duru C, Atouf F. Pharmaceutical Research, 2023, volume 40(6), pages 1317-1328. PubMed ID 36949371. DOI 10.1007/s11095-023-03493-1. Descriptor: review of how reference standards for synthetic peptides are produced and characterized.
Want the catalog? Register free