
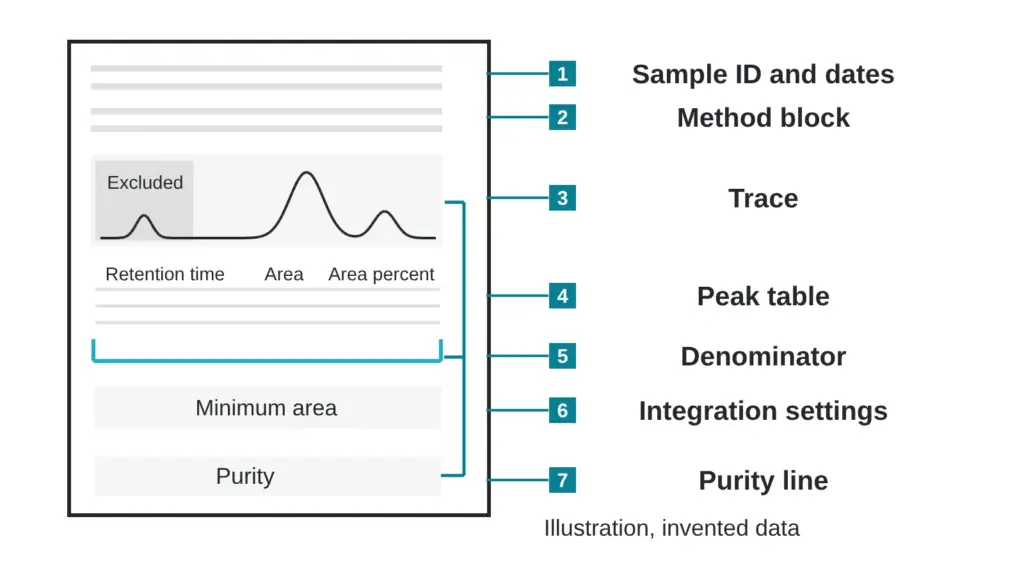
A lab sends back a single page. Near the bottom, one line reads “Purity (area %): 90.4.” Everything above that line exists so you can judge whether to believe it, and most readers never look at any of it.
This guide walks down an invented report page from the sample ID to the integration settings. Every number is invented for teaching, and none describes a real sample. Terms are defined in the The testing glossary: 14 lab terms in plain English.
The purity line is the punchline. The fields above it are the setup, and a punchline with no setup cannot be checked.
What is in the header block?
The top of the page ties the trace to a physical vial and a calendar.
| Field | Invented value |
|---|---|
| Sample ID | TEST-A17 |
| Run date | 14 March 2026 |
| Processed date | 15 March 2026 |
| Column | C18, 2.1 x 100 mm, 1.7 micrometer particles |
| Mobile phase | A: water with an acid modifier. B: acetonitrile with the same modifier |
| Gradient | 5 to 60 percent B over 12 minutes |
| Flow and temperature | 0.4 mL per minute, 40 degrees Celsius |
| Detector | Ultraviolet absorbance at 214 nm |
| Sample load | 2 microliters |
Read the sample ID first. It should match the label on your container character for character, and it should match the ID on every other page of the report package. A mismatch means the page may describe a different vial.
Then read the dates. The run date is when the instrument measured. The processed date is when someone drew the baselines and integrated the peaks. A gap of one day is normal. A processed date earlier than the run date is a flag. The longer story of report dates is in Five dates on a COA and what each one really means.
Why does the method header matter?
The method block is the recipe. Retention times, peak shapes and even which impurities show up depend on the column, the solvents, the gradient, the temperature and the detector wavelength. Change any of them and the same sample draws a different picture.
Two details deserve a second look. The gradient says how fast the solvent mix changes, and a steeper gradient squeezes peaks together. The wavelength says which light the detector watches. A species that absorbs weakly at 214 nm is under-counted, and one that absorbs not at all is invisible. See Area percent vs weight percent: the difference almost nobody explains for why that matters.
How do you read the peak table?
Here is the invented peak table for TEST-A17.
| Peak | Retention time (min) | Area (invented units) | Area % | Note |
|---|---|---|---|---|
| 1 | 0.95 | 41,200 | excluded | solvent front |
| 2 | 6.12 | 52,300 | 1.6 | |
| 3 | 7.48 | 118,900 | 3.7 | |
| 4 | 8.03 | 2,874,500 | 90.4 | main peak |
| 5 | 8.31 | 96,400 | 3.0 | close neighbor of peak 4 |
| 6 | 9.77 | 38,100 | 1.2 |
Retention time is the minute at which the peak summit crosses the detector. Under one fixed method, the same molecule leaves at nearly the same time, so a reference run on the same system gives you something to compare against. Retention times cannot be compared across different methods.
Area is the signal summed across the width of the peak. It is the number that purity calculations use, because a wide, short peak and a narrow, tall one can carry the same amount of signal.
Area percent is each peak’s area divided by the total area of the counted peaks. For peak 4: 2,874,500 divided by 3,180,200 gives 90.4 percent. Notice what the denominator leaves out. Peak 1 is excluded as the solvent front. If a lab had counted it, the main peak would drop to 89.2 percent. Neither choice is wrong, but the report should say which one it made.
Peak 5 sits only 0.28 minutes after the main peak. A neighbor that close is the first suspect for overlap, which is the subject of One peak, two molecules: how co-elution hides what is in a sample.
What do the integration settings change?
Somewhere on the page, often in small type, are the integration settings: a threshold for how tall a bump must be to count, a minimum area, a rule for peak width, and a baseline mode. They are the hidden dials.
Take the invented minimum-area setting. At a minimum of 20,000 units, all five sample peaks count and the main peak reads 90.4 percent. Raise the minimum to 50,000 and peak 6 (area 38,100) disappears from the table. The denominator shrinks to 3,142,100 and the same main peak now reads 91.5 percent. Nothing in the vial changed. One dial moved the headline by more than one point.
The baseline mode works the same way. The software draws a line under each peak and counts the area above it. Different line choices cut a shoulder off or fold it in. A report that lists its integration settings lets a second analyst reproduce the number. A report that omits them asks for trust.
Is there a peak-purity field?
Some reports add a peak-purity index or a note that the main peak was checked with a diode-array detector or mass spectrometry. For pharmaceutical peptides, the authors of a two-dimensional liquid chromatography strategy describe it as critical to ensure that no impurities co-elute with the target, a challenge that comes from the broad range of impurity properties and from impurities very similar to the target (Stoll et al., 2023). Their companion paper adds a limit for mass detection: compounds with the same mass-to-charge ratio are not readily differentiated by mass spectrometry and must be separated chromatographically (Petersson et al., 2023).
A blank field leaves the question unanswered on this page, and the next step is to ask.
The reference line
Last, look for a reference. Identity, purity and strength tests depend on well-characterized reference standards (McCarthy et al., 2023). A page that matches the main peak to a reference run should name the reference material and say how its value was assigned. That topic gets its own article: Reference standards: the quiet argument behind every purity number.
Quick check you can do today
Take any report page and tick eight boxes: sample ID matches your label, run date, processed date, column, gradient, wavelength, a listed integration threshold, and a statement of what was excluded from the denominator. Count the ticks. Eight is a page you can check. Five or fewer means you can read a number but not test it. The missing items are your questions for the lab.
Sources
- Stoll DR, Sylvester M, Euerby MR, Buckenmaier SMC, Petersson P. Journal of Chromatography A, 2023, volume 1693, article 463873. PubMed ID 36871316. DOI 10.1016/j.chroma.2023.463873. Descriptor: method-development paper on two-dimensional liquid chromatography with mass spectrometry for peak purity of pharmaceutical peptides.
- Petersson P, Buckenmaier S, Euerby MR, Stoll DR. Journal of Chromatography A, 2023, volume 1693, article 463874. PubMed ID 36841023. DOI 10.1016/j.chroma.2023.463874. Descriptor: method-development paper (part one of two) on selecting columns and mobile phases for peak-purity assessment of pharmaceutical peptides.
- McCarthy D, Han Y, Carrick K, Schmidt D, Workman W, Matejtschuk P, Duru C, Atouf F. Pharmaceutical Research, 2023, volume 40(6), pages 1317-1328. PubMed ID 36949371. DOI 10.1007/s11095-023-03493-1. Descriptor: review of how reference standards for synthetic peptides are produced and characterized.
Want the catalog? Register free