
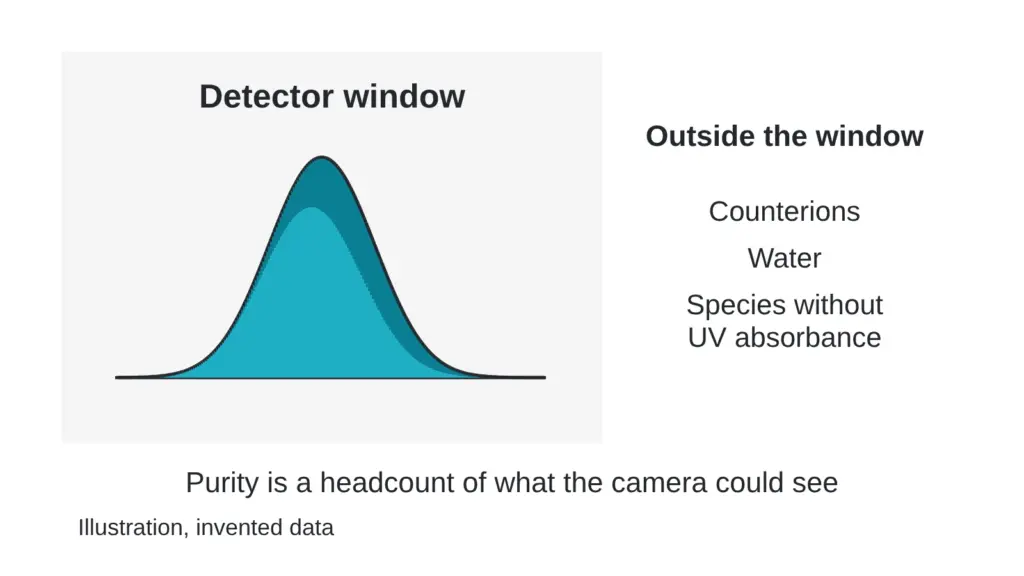
A report says 93.5 percent purity. That number is invented here, but it looks like thousands of real ones. Is it 93.5 percent of the powder in the vial? No. The figure describes something narrower, and the gap between the two is the whole story.
This article explains what a UHPLC purity percentage counts, what it cannot see and which questions to ask next. Terms are in the The testing glossary: 14 lab terms in plain English.
A UHPLC purity figure is a headcount of the people the camera could see, and it says nothing about the people elsewhere in the building.
What happens inside the instrument
UHPLC is the ultra-high-pressure form of liquid chromatography. A small amount of sample is dissolved and pumped through a tightly packed column. Different molecules travel at different speeds, so they leave the column at different times. A detector at the exit, usually measuring ultraviolet light absorbed near 210 to 220 nanometers for peptides, draws a trace of signal against time. Each peak is a molecule or a group of molecules arriving together. How to read a chromatogram: what the peaks, shoulders and baseline say covers the trace itself.
What the percentage is
Software finds the peaks, measures the area under each and divides the main peak’s area by the total of all integrated peaks. Invented example: the main peak has an area of 935 units and the other integrated peaks add up to 65. The total is 1,000, so the area percent is 93.5.
That is a share of detector signal at one wavelength, under one method, using whatever peaks the software chose to integrate. Area percent vs weight percent: the difference almost nobody explains takes the difference between signal share and mass share apart with numbers.
What it cannot see
| Blind spot | Why the detector misses it |
|---|---|
| Counterions | they give no useful UV signal under routine conditions |
| Water | it does not absorb at the wavelengths used |
| Co-eluting species | they leave the column together with the main peak and count as one peak |
| Species without UV absorbance | a molecule that absorbs little or nothing adds little or nothing to the area |
| Species that respond differently | a molecule with a stronger or weaker signal per unit mass is over- or under-counted |
Take them in turn.
Counterions and water make up part of the mass of a dry powder and appear in no UV peak. Mass-balance work measures them with other tools: Karl Fischer titration for water, ion chromatography for non-volatile counterions (Wang et al., 2021). Counterion amounts vary. In one study of batches of a synthetic peptide, the counterion mass percentage ran from zero to about 11 percent for one acid (Sázelová et al., 2006).
Co-elution is the hidden one. Mass spectrometry cannot always reveal it, because compounds with the same mass-to-charge ratio are not readily told apart by mass and must be separated by the column. One two-dimensional liquid chromatography strategy was built for exactly that, to assess whether the main peak of a pharmaceutical peptide is pure (Petersson et al., 2023).
Response differences matter too. An analytical chemistry article on peptide impurities notes that assuming a relative response factor of 1 for every impurity can overestimate or underestimate their amounts (Kuril, 2025).
Same line on the report, three different powders
Here is why the blind spots matter. Three invented powders each show a purity line of 93.5 area percent. Their other components differ, and an equal detector response is assumed.
| Invented powder | Area percent | Water | Counterion | Other | Main species by weight |
|---|---|---|---|---|---|
| A | 93.5 | 3.0 percent | 9.0 percent | 1.0 percent | 81.3 percent |
| B | 93.5 | 8.0 percent | 17.0 percent | 1.0 percent | 69.2 percent |
| C | 93.5 | 10.0 percent | 22.0 percent | 3.0 percent | 60.8 percent |
The report line is identical. The powders are not. Each weight share is the area fraction multiplied by what remains after water, counterion and other material are taken out.
Three myths, three corrections
Myth: a high purity percentage means most of the vial is the target molecule. Reality: the percentage describes the signal among the peaks that were integrated, and the vial also holds components with no peak.
Myth: one clean peak means one compound. Reality: a single peak means one arrival time, and several species can share it.
Myth: the higher of two purity figures belongs to the better sample. Reality: two figures from two methods compare only when the methods match, and a figure from a method that separates more species can come out lower for the same material.
What a good number does tell you
A high area percent under a clearly described method is evidence of a clean separation by that method. It says the detector saw few other things next to the main peak. That is useful, and it is also one measurement. Two laboratories can reasonably report different figures for the same sample, because column, gradient, wavelength and integration all shape the number.
What to ask next
- Which wavelength, column and gradient produced this number?
- Was the main peak checked for co-elution, with mass spectrometry or a second method?
- What reporting threshold was used for minor peaks?
- Is there a separate content value, and how was it measured?
- Were water and counterions measured, and by which techniques?
- Can I see the whole trace, not only the area table?
Each question points to a different method, and CHNS, liquid chromatography or LC-MS: which test answers which question? matches them up. Counterions are covered in The salt nobody lists: how a counterion changes what a vial really holds.
Quick check you can do today: pick up any purity report and find the wavelength. If it is missing, the number cannot be compared with any other. If it is present, look for a content line beside it.
Sources
- Petersson P, Buckenmaier S, Euerby MR, Stoll DR. Journal of Chromatography A, 2023, volume 1693, article 463874. PubMed ID 36841023. DOI 10.1016/j.chroma.2023.463874. Descriptor: two-dimensional liquid chromatography with mass spectrometry for assessing main peak purity of pharmaceutical peptides.
- Wang S, Wu P, Li M, Huang T, Shi N, Feng L, Li H. Journal of Pharmaceutical and Biomedical Analysis, 2021, volume 207, article 114401. PubMed ID 34656934. DOI 10.1016/j.jpba.2021.114401. Descriptor: mass balance purity assignment for a synthetic peptide, including water, counterion, inorganic and volatile solvent determinations.
- Kuril AK. Analytical Chemistry, 2025, volume 97(24), pages 12480-12485. PubMed ID 40499007. DOI 10.1021/acs.analchem.5c02149. Descriptor: article on relative response factors in peptide impurity quantification by liquid chromatography with UV detection.
- Sázelová P, Kasicka V, Solínová V, Koval D. Journal of Chromatography B, 2006, volume 841(1-2), pages 145-151. PubMed ID 16687256. DOI 10.1016/j.jchromb.2006.04.006. Descriptor: capillary electrophoresis determination of purity and counterion content in batches of a synthetic peptide.
Want the catalog? Register free