
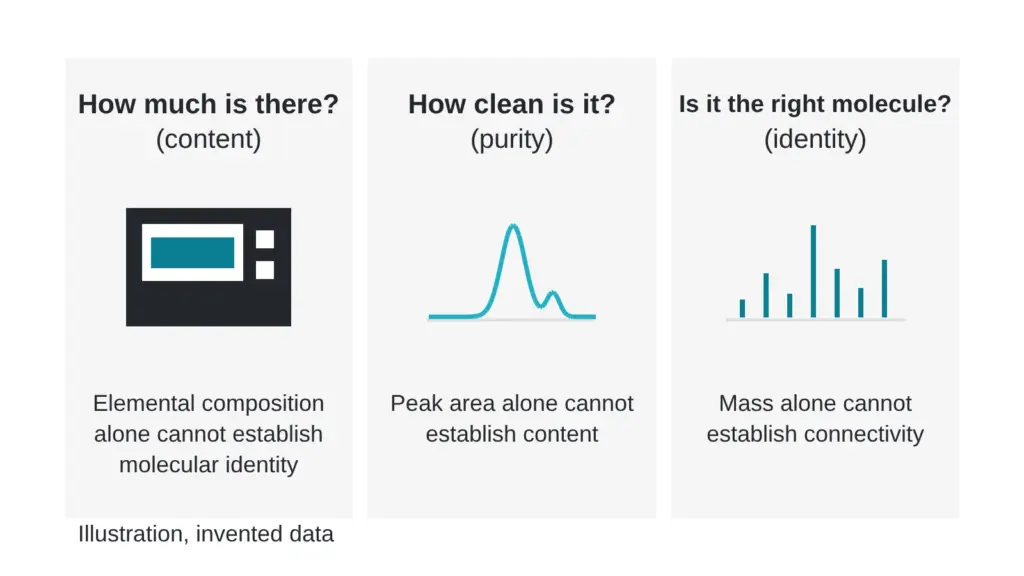
Three methods appear on most analytical reports for synthetic peptides: elemental analysis (CHNS), liquid chromatography with ultraviolet detection, and liquid chromatography coupled to mass spectrometry (LC-MS). Readers often treat them as interchangeable. They are not, because each one measures a different property of the sample. Terms are defined in the The testing glossary: 14 lab terms in plain English.
Start with the question
| Question | Method that speaks to it | What it cannot say |
|---|---|---|
| How much of the dry solid is the target molecule? (content) | Elemental analysis, amino acid analysis or a calibrated chromatographic assay | Which species carry the nitrogen, and whether impurities are present |
| How much of the detected material sits in the main peak? (purity) | Liquid chromatography with ultraviolet detection | How many milligrams are in the vial |
| Is the molecular mass right? (identity) | LC-MS | Counterion content and elemental composition |
What CHNS elemental analysis measures
The instrument burns a weighed sample and reports carbon, hydrogen, nitrogen and sulfur as percentages of the sample mass. Amino acids carry nitrogen in predictable proportions, so the nitrogen value is the most useful one for a peptide.
A content estimate works by comparing the measured nitrogen percentage with the percentage expected for the pure molecule. That comparison is valid only when the peptide is the sole source of nitrogen. The instrument cannot tell one nitrogen source from another, so any other nitrogen-containing material in the solid inflates the apparent content.
CHNS does not produce an impurity profile, does not detect structural variants, and does not see elements outside C, H, N and S, such as sodium or chlorine.
A comparison of four content methods on one drug substance, namely elemental analysis (CHN), quantitative amino acid analysis, liquid chromatography and the Kjeldahl nitrogen method, found that amino acid analysis was highly variable in one laboratory and precise in another, and that liquid chromatography values depended on the laboratory. CHN produced precise values with a coefficient of variation under 2 percent, and the author recommended it for that material (Vemuri, 2005). That is one material in one study, so read it as an example and not as a rule.
What liquid chromatography measures
A chromatography column separates the components of a dissolved sample, and a detector draws each one as a peak. The main peak is the target molecule. Smaller peaks are other species: truncated chains, products of degradation, leftovers from synthesis.
Area percent purity is the main peak area divided by the total area of all peaks. It is a ratio inside the chromatogram. It does not say how much material is in the vial, and it moves with the column, the gradient and the detection wavelength. See What a UHPLC purity number actually measures, and what it skips for the mechanics.
Absolute amounts from ultraviolet detection need a calibrated reference standard, a validated method and tight control of conditions, because different molecules absorb light to different degrees.
What LC-MS measures
LC-MS adds a mass spectrometer after the column. It reports the mass-to-charge ratio of what elutes, which confirms the molecular mass of the main peak, flags species with unexpected masses, and, through fragmentation, can show modifications such as oxidation or a missing residue.
Under routine conditions the instrument reads the peptide itself, not the counterion that balances its charge, so LC-MS does not establish salt form. It also gives no elemental composition. The counterion topic is covered in The salt nobody lists: how a counterion changes what a vial really holds, and the identity workflow in How labs confirm what a molecule is: mass, fragments and structure.
Worked example with invented numbers
Suppose 10.0 mg of dry solid is weighed. The pure molecule is 20.0 percent nitrogen by mass in this teaching example, and elemental analysis finds 17.0 percent nitrogen in the solid.
If the peptide is the only nitrogen source, the content estimate is 17.0 divided by 20.0, or 85 percent, which is 8.5 mg of the 10.0 mg. The remaining 1.5 mg is water, counterions and salts.
Liquid chromatography then shows the main peak at 90.0 percent of the detected area. A rough estimate of the main species is 8.5 mg times 0.900, about 7.7 mg, assuming every species responds equally to the detector. In practice responses differ, so treat that product as a ballpark.
LC-MS then shows an observed mass within a few parts per million of the theoretical mass.
Three methods gave three different answers, 85 percent content, 90.0 percent purity and a correct mass, and none of them could have produced the other two.
Using the methods together
Reference-standard programs do exactly this. A review from the United States Pharmacopeial Convention describes a two-step value assignment in which a mass balance approach assigns a quantitative value to bulk peptide material, identity is checked by NMR, mass spectrometry and chromatography, and content and impurities are assessed with liquid chromatography and gas chromatography (McCarthy et al., 2023).
Content is hard enough that some groups build special methods for it. One published method measures sulfur-containing amino acids by isotope dilution to give traceable peptide content, motivated by the fact that the few commercial standards available vary in purity (Schaier et al., 2021).
What to ask a laboratory
- Which question does this value answer: content, purity or identity?
- If a content value is given, which method produced it, and is the peptide the only nitrogen source?
- If a purity value is given, at what wavelength and with what column?
- Was identity confirmed by mass, and by fragmentation?
Sources
- Vemuri S. Journal of Peptide Research, 2005, volume 65(4), pages 433-439. PubMed ID 15813890. DOI 10.1111/j.1399-3011.2005.00225.x. Descriptor: comparison of four peptide content assays on one lyophilized drug substance.
- McCarthy D, Han Y, Carrick K, Schmidt D, Workman W, Matejtschuk P, Duru C, Atouf F. Pharmaceutical Research, 2023, volume 40(6), pages 1317-1328. PubMed ID 36949371. DOI 10.1007/s11095-023-03493-1. Descriptor: analytical strategy for peptide reference standards, including mass balance value assignment and identity testing.
- Schaier M, Hermann G, Koellensperger G, Theiner S. Analytical and Bioanalytical Chemistry, 2021, volume 414(1), pages 639-648. PubMed ID 34355254. DOI 10.1007/s00216-021-03571-6. Descriptor: isotope-dilution method for traceable peptide content.
Want the catalog? Register free